. 2021 Mar 26;10:e63642. doi: 10.7554/eLife.63642

Figure 3. Expression of type II ODP of microbial species within the intestinal microbiota of healthy humans.

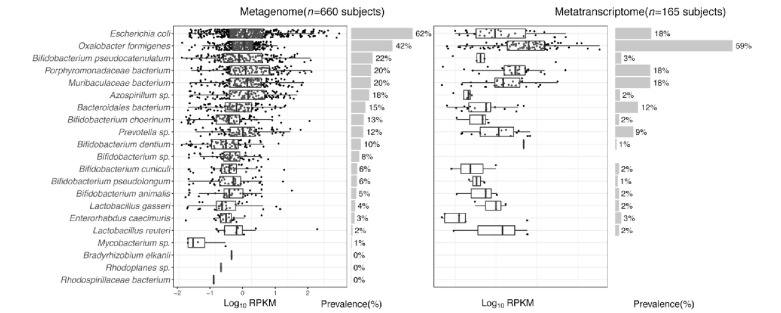
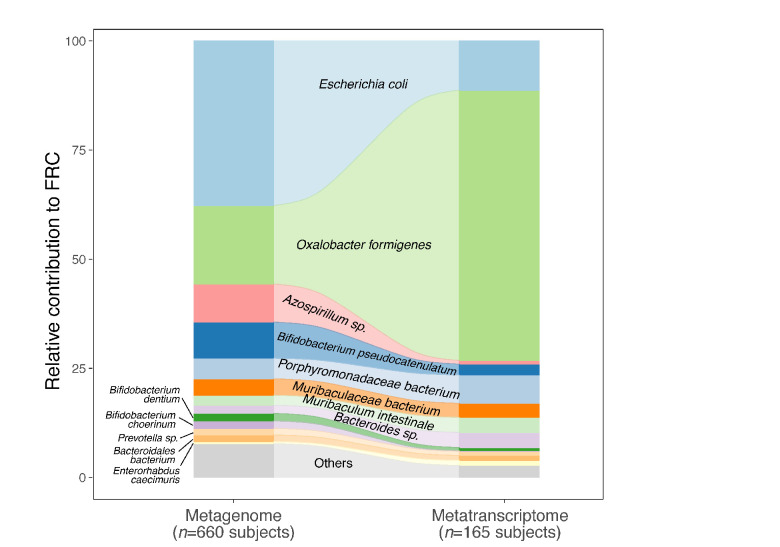
(A) Abundance and prevalence of OXC of microbial species in the metagenome (left) or metatranscriptome (right) of 660 and 165 subjects. Box plots indicate the abundance of microbial OXC (log10 RPKM) among subjects in whom OXC is detected, and are generated with ggplot2 with outliers excluded. Bar plots indicate the prevalence of microbial oxc, with percentage annotated. Microbial species are ordered by the corresponding metagenomic OXC prevalence. A parallel analysis for FRC is shown in Figure 3—figure supplement 5. (B) Detection of OXC and FRC of microbial species in the subject-matched metagenome and metatranscriptome, by study. For each microbial ODE, the subjects are divided into four groups (shown in different colors) based on the co-detection of ODE in the matched metagenome and metatranscriptome, with percent (%) of which reflected. The fran Study, from which E. coli ODP was detected in all subjects, used a sample extraction method known to induce E. coli, as noted in their publication (Franzosa et al., 2014). (C) Population-level contribution of individual species to metagenomic (left) or metatranscriptomic (right) OXC. The population-level contribution of each species was calculated at a relative scale (see Materials and methods) and plotted. Raw values can be found in Supplementary file 1a. The 10 species that have the highest metagenomic or metatranscriptomic contribution are shown. A parallel analysis for FRC is shown in Figure 3—figure supplement 3.

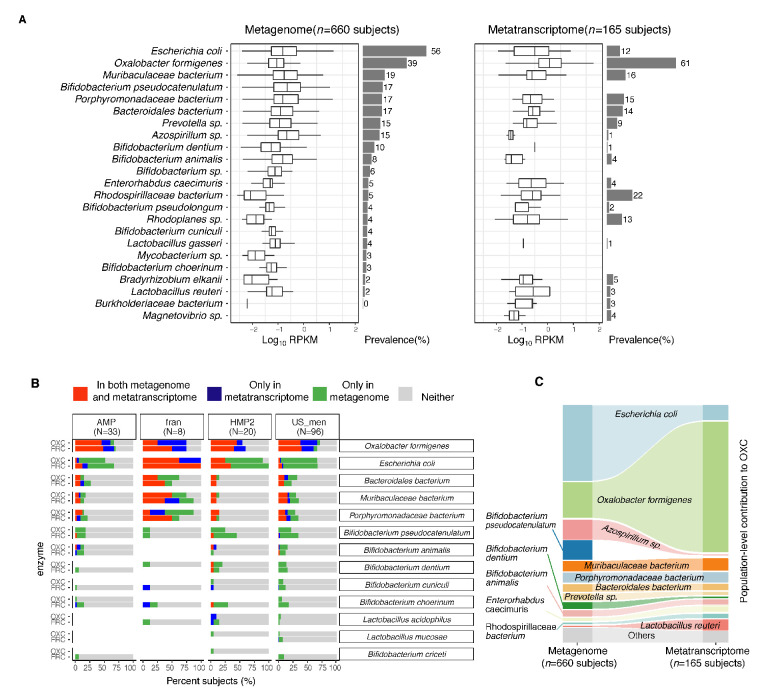
Figure 3—source data 1. Species contribution to FRC, and OXC in the metagenome and metatranscriptome of healthy individuals.
elife-63642-fig3-data1.xlsx (515.6KB, xlsx)

Figure 3.

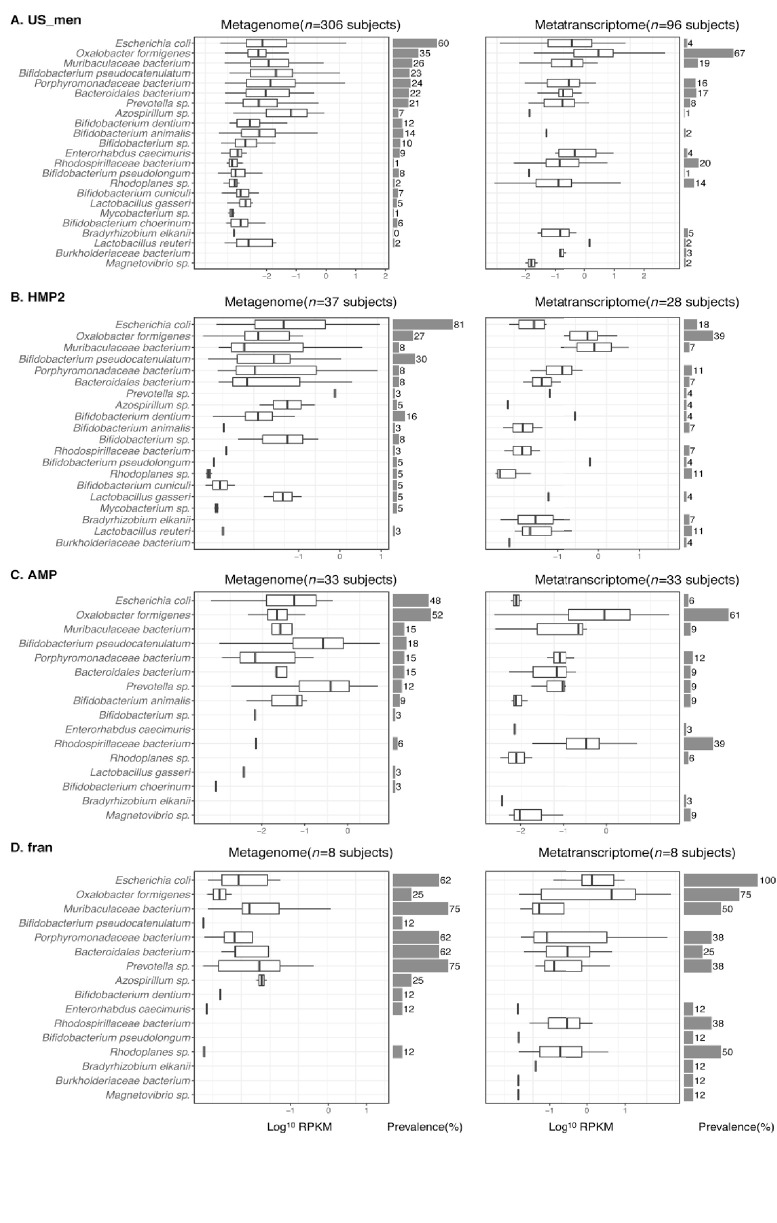
Figure 3—figure supplement 1. Detection of OXC of microbial species in the microbiome of healthy human subjects from US_men (A), HMP2 (B), AMP (C), or fran (D) study.

Figure 3—figure supplement 1.

Left and right panels focus on detection in metagenomic and metatranscriptomic data, respectively. (Follows legend of Figure 3A.)
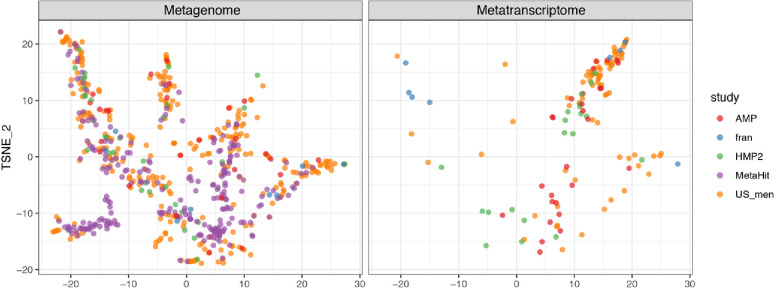
Figure 3—figure supplement 2. Tsne plot of 594 metagenomic and 131 metatranscriptomic samples, based on the abundances OXC and FRC.

Figure 3—figure supplement 2.

OXC and FRC of microbes in Figures 3A and 5 were used. Tsne is calculated with Rtsne v0.15 package in R. The OXC- and FRC-specific study effects are not significant, examined using PERMANOVA using 1000 permutations (p>0.1).
Figure 3—figure supplement 3. Detection of FRC of microbial species in the metagenome (left) or metatranscriptome (right) of healthy human subjects.

Figure 3—figure supplement 3.

(Follows the legend for Figure 3A).
Figure 3—figure supplement 4. Population-level contribution of individual species to metagenomic (left) or metatranscriptomic (right) FRC.

Figure 3—figure supplement 4.

Follows the legend for Figure 3D.
Figure 3—figure supplement 5. Detection of ODE using ShortBRED.

Figure 3—figure supplement 5.

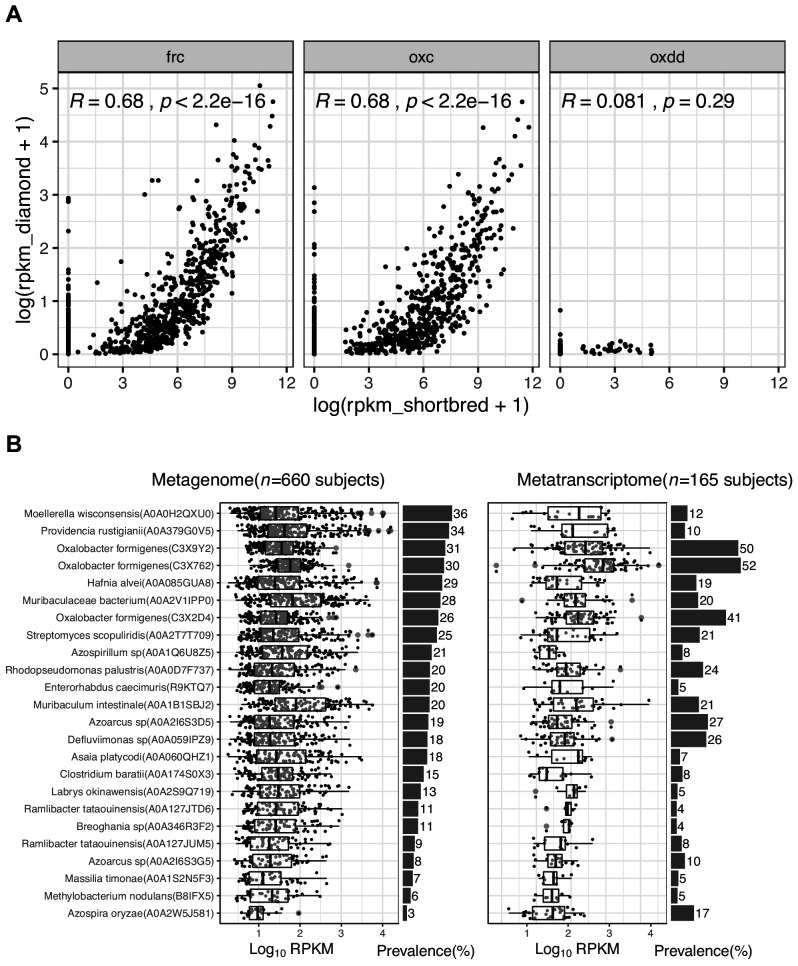
(A) Comparison of ODE detection using ShortBred and using Diamond in all samples (n = 5557) included in this present study. Each point represents the total abundance of FRC, OXC, or OXDD homologs in one individual. Mean measurements were used for study subjects who provided multiple samples. Statistics were generated using Spearman correlations. (B). Abundance and prevalence of FRC of microbial species in the metagenome (left) or metatranscriptome (right) of 660 and 165 subjects. Detection of FRC and OXC protein families by ShortBRED using default parameters. The text on the left indicates the centroid protein for each protein homolog. (B) FRC: All three O. formigenes FRCs (C3 × 9Y2, C3 × 762, and C3 × 2D4) are in a protein family that contains only that one enzyme (See New Supplement File 1 for the clustering centroid-member map). (C) OXC. Unlike results for FRC, no O. formigenes OXC homologs were detected.
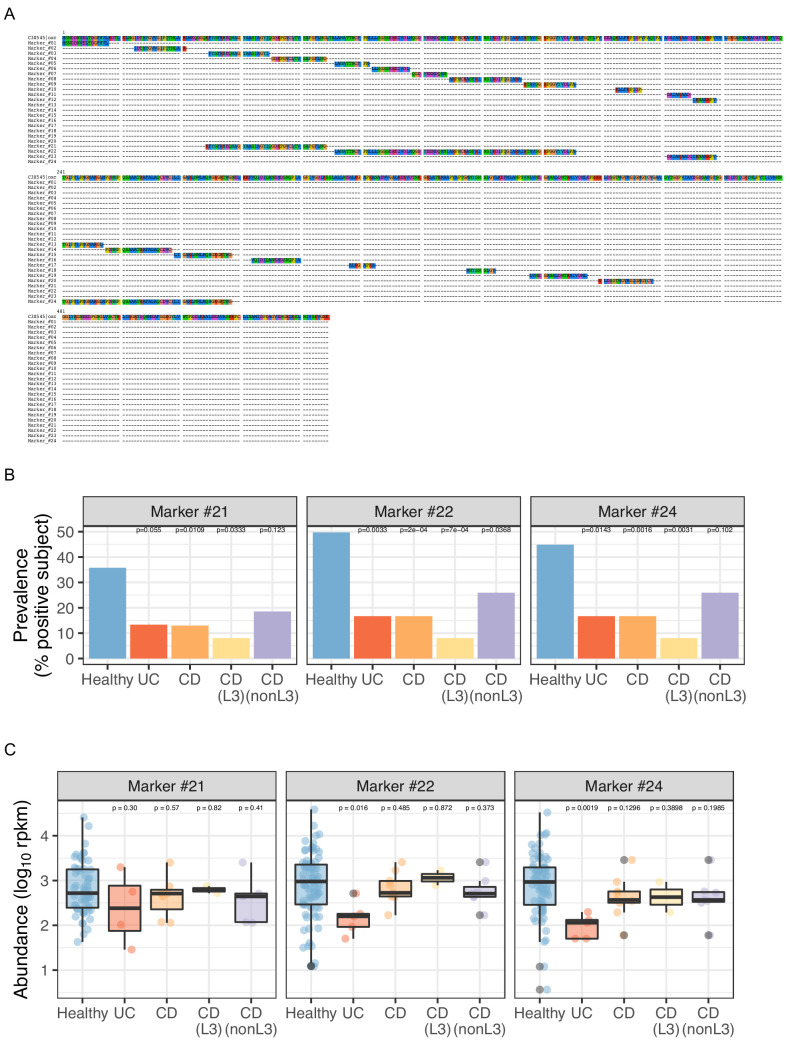
Figure 3—figure supplement 6. Detection of O. formigenes OXC using merged long marker peptides identified by ShortBRED.

Figure 3—figure supplement 6.

(A) Multiple alignment of 5 and the marker peptides. A total of 20 marker peptides (Marker_#1 - Marker_#20) with 16.5 amino acid (AA) median length were identified by ShortBRED-identify using default parameters. Peptides one AA apart were further merged (including the gap AA) into four long marker peptides #21–#24 with median length of 48.5 AA. (B,C) Prevalence (% subject positive) (B) and abundance (C) of merged marker peptides in metatranscriptomes, detected by ShortBRED. The shortest Marker #23 (17 AA) is not detected in any sample. Statistics were done compared to Healthy subjects as the reference for proportion tests (B) and Wilcoxon rank tests (C) with adjustment for multiple comparisons.