. 2021 Mar 26;10:e63642. doi: 10.7554/eLife.63642

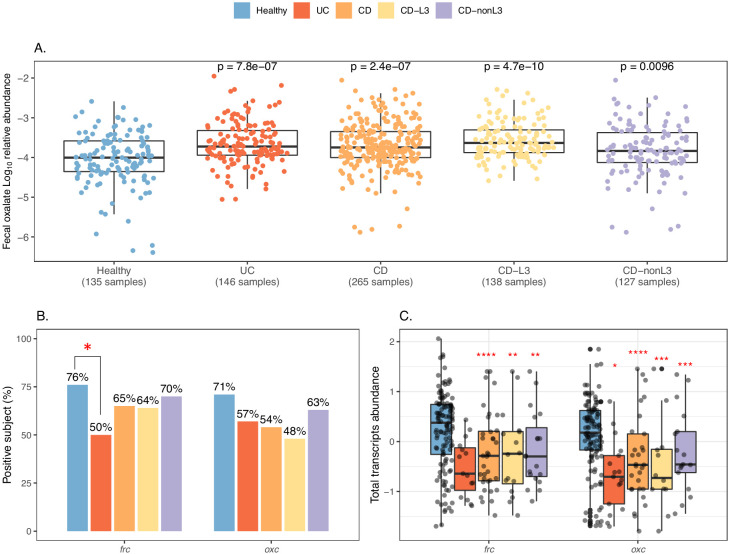
Figure 4. Elevated fecal oxalate and reduced expression of microbiome ODP in IBD patients.

(A). Stool oxalate relative abundance (log10) in healthy, UC, CD, CD-L3, or CD-nonL3 subjects from HMP-IBD study. Fecal oxalate relative abundance was determined from untargeted metabolomics data from the iHMP-IBD; measurements related to oxalate were selected and normalized against total metabolites (percent abundance of all observed metabolites) for analysis. L3 refers to the ileocolonic phenotype, according to the Montreal Classification at baseline. Data derived from iHMP-IBD untargeted metabolomics measurements. Prevalence (B) and abundance (C) of OXDD, FRC, and OXC in metatranscriptomes of healthy, UC, CD, or CD-L3 subjects. The 165 healthy controls are combined from four studies (AMP, US_men, fran, HMP2). *: p<0.05, **: p<0.01, ***: p<0.001, ****: p<0.0001 by multiple-adjusted Mann-Whitney tests in (A) and (C), by proportion test in (B).

Figure 4—source data 1. Fecal oxalate and ODE expression in healthy and IBD individuals.

Figure 4.

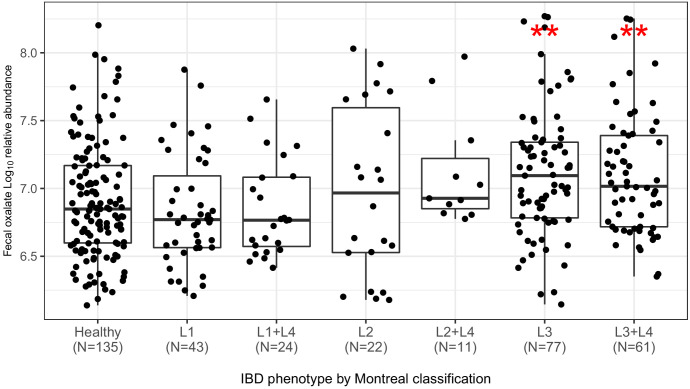
Figure 4—figure supplement 1. Fecal oxalate log10 relative abundance in CD patients, according to the Montreal clinical classification (Satsangi et al., 2006).

Figure 4—figure supplement 1.

***p<0.001 by Mann–Whitney test.
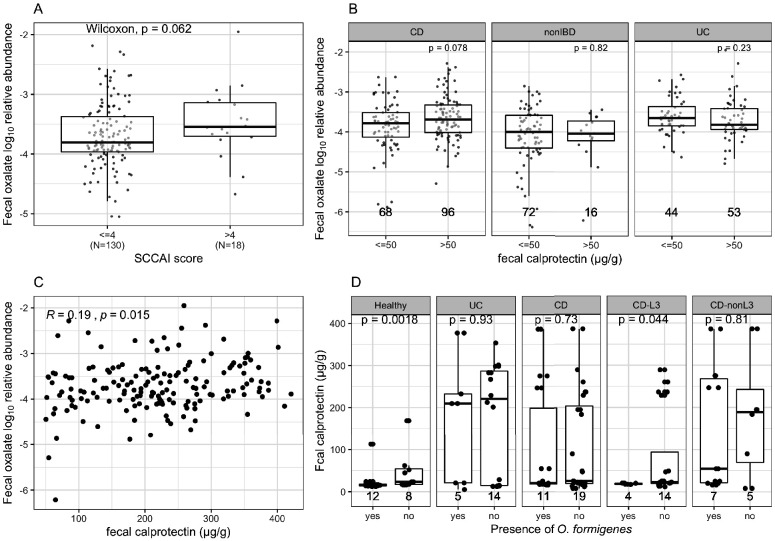
Figure 4—figure supplement 2. Comparison of fecal oxalate log10 relative abundance based on disease activity by fecal calprotectin levels or SCCAI scores.

Figure 4—figure supplement 2.

(A) 148 UC patients were divided into two groups based on SCCAI score above and below 4. (B) Subjects were divided based on whether or not fecal calprotection was >50 µg/g (Damms and Bischoff, 2008; Manz et al., 2012; Pathirana et al., 2018). The number of samples in each group is indicated under each box. (C) Spearman correlation between fecal calprotectin (µg/g) and fecal oxalate log10 relative abundance, in samples with calprotectin > 50. (D) Fecal calprotectin levels in association with O. formigenes status in 152 samples from 38 subjects enrolled in iHMP2, according to clinical diagnosis. The presence of O. formigenes was determined by whether O. formigenes frc or oxc was detected in the metagenome or metatranscriptome samples collected from the same subject during the same visit (matched accession ID). The number of samples in each group is indicated under each box. Statistics were done using Wilcoxon Rank Sum tests for (A), (B), and (D).
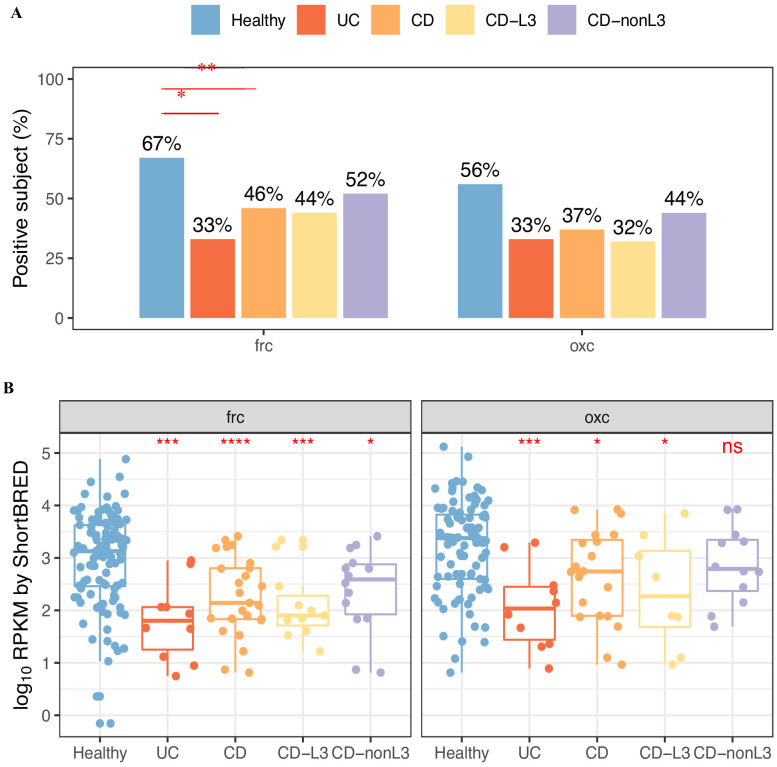
Figure 4—figure supplement 3. Prevalence (A) and abundance (B) of FRC, and OXC in metatranscriptomes of healthy, UC, CD, or CD-L3 subjects detected by ShortBRED.

Figure 4—figure supplement 3.

The 165 healthy controls are combined from four studies (AMP, US_men, fran, HMP2). *p<0.05, **p<0.01, ***p<0.001, ****p<0.0001 by multiple comparison adjusted proportion tests in (A) and Mann–Whitney tests in (B).
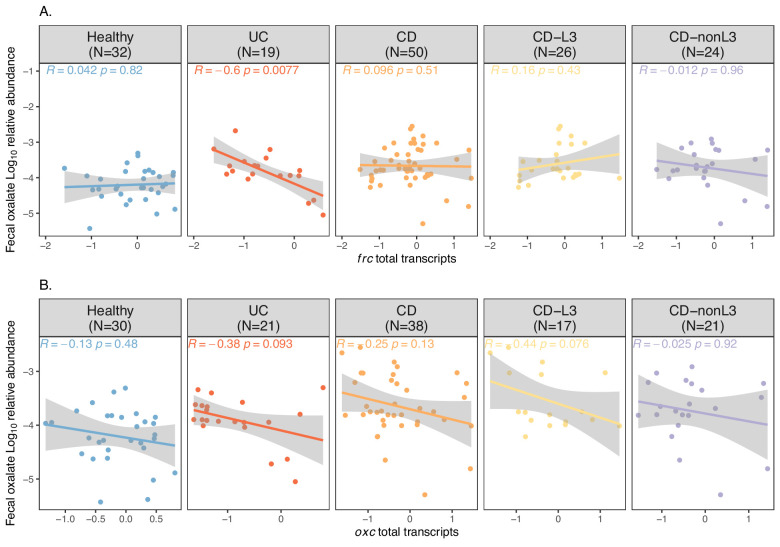
Figure 4—figure supplement 4. Spearman correlations of fecal oxalate and total transcripts of frc (A) or oxc (B).

Figure 4—figure supplement 4.

The x axis is the log10 abundance of total transcript, which determined by RPKM sum of all homologs in a metatranscriptome samples. The y axis shows the fecal oxalate log10 relative abundance. Spearman Rho and p values are shown.
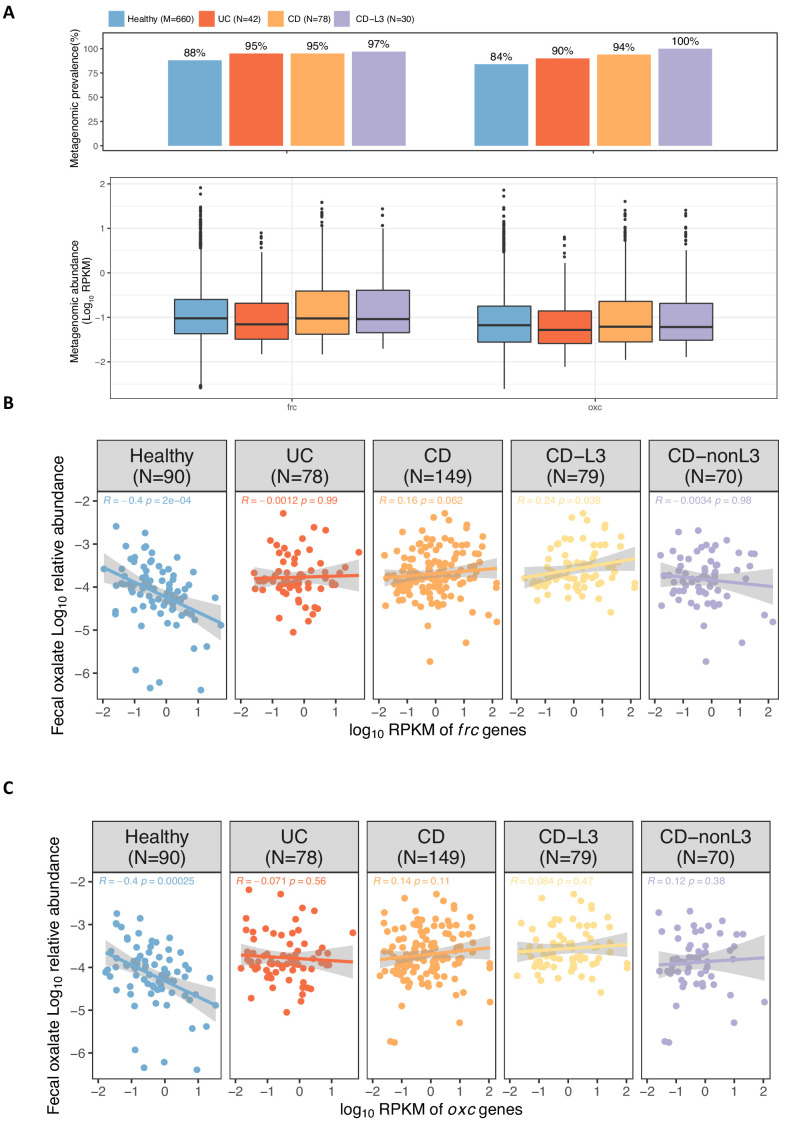
Figure 4—figure supplement 5. Abundance of frc and oxc genes in the metagenome of IBD patients and healthy individuals.

Figure 4—figure supplement 5.

(A) Metagenomic prevalence (top) and abundance (bottom) of frc and oxc in healthy, UC, CD, and CD-L3 subjects. (B, C) Spearman correlation of fecal oxalate log10 relative abundance and total metagenomic frc (B) and oxc (C) abundance.