. 2021 Apr 22;10:e63713. doi: 10.7554/eLife.63713

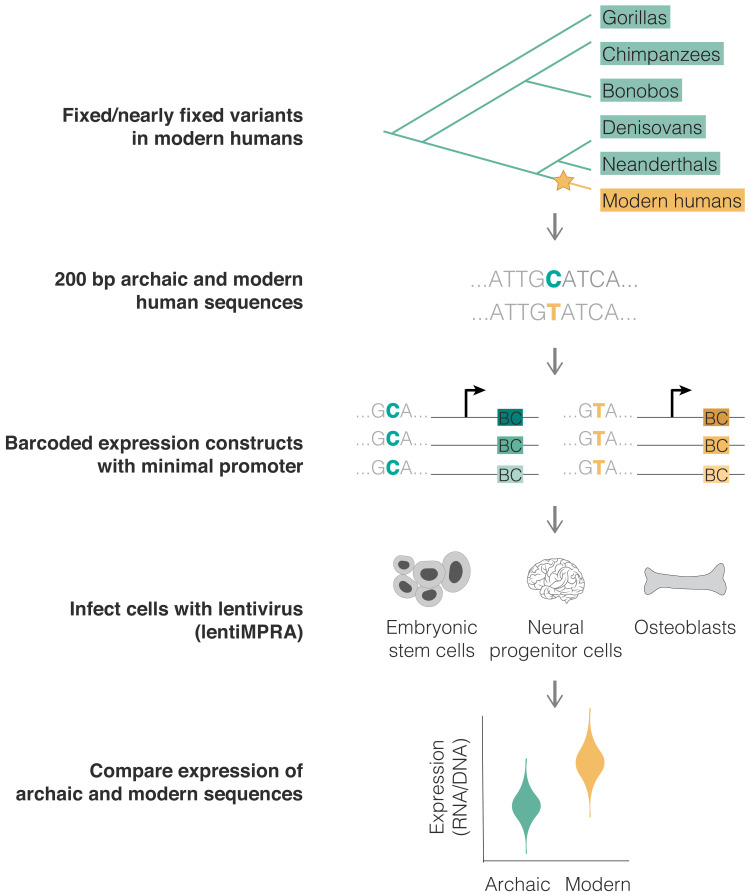
Figure 1. Using lentivirus-based MPRA (lentiMPRA) to identify variants driving differential expression in modern humans.

Figure 1.

Figure 1—figure supplement 1. Classification of chromHMM annotations for different groups of variants.

Figure 1—figure supplement 1.

Relative percentage of bases in each chromHMM (Ernst and Kellis, 2012; Kundaje et al., 2015) category throughout the entire genome (a), in fixed or nearly fixed modern human-derived variants (b), in active sequences (c), and in differentially active sequences (d), per cell type. See Discussion for cell-type specificity and enhancer enrichment. (e) Histogram of the number of tissues and number of sequences with transcription start site- (TSS) or enhancer-related chromHMM marks for all 14,042 sequences. Tissues and cell types investigated include embryonic stem cells (ESCs), osteoblasts, neural progenitor cells (NPCs), mesenchymal stem cells, monocytes, skin fibroblasts, brain hippocampus, skeletal muscle, heart left ventricle, sigmoid colon, ovary, fetal lung, and liver. Inset shows data for ESC, osteoblast, and NPC only.
Figure 1—figure supplement 2. Reproducibility of lentivirus-based MPRA (lentiMPRA) data.

Figure 1—figure supplement 2.

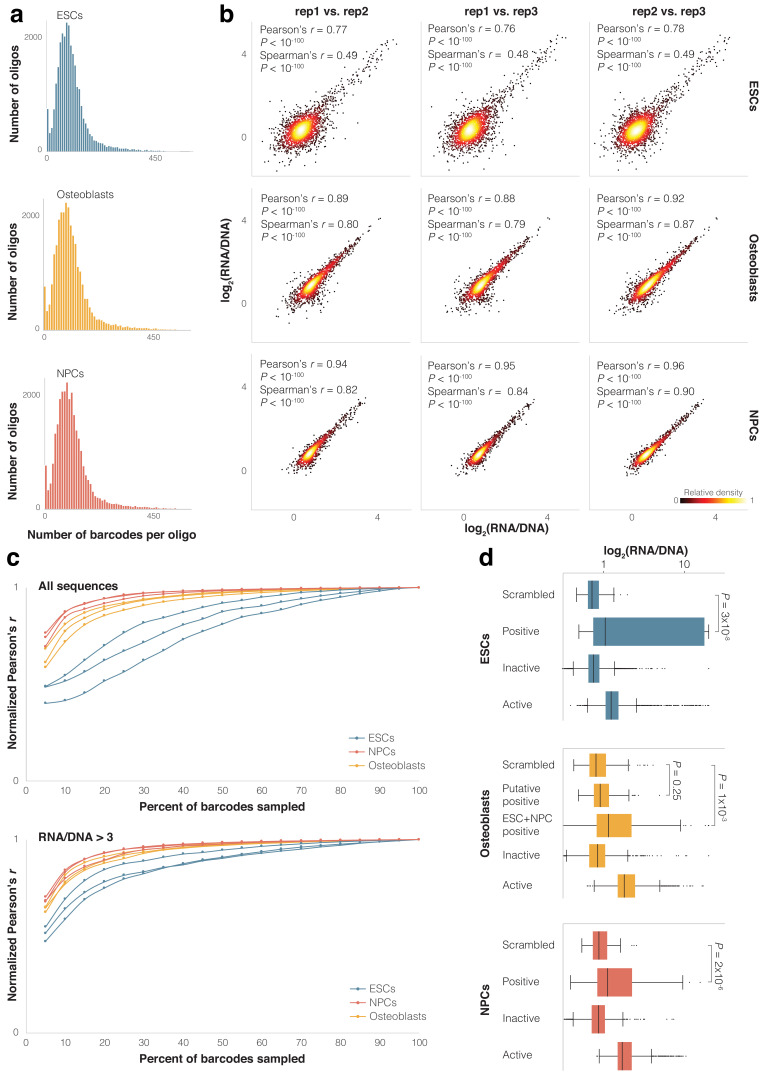
(a) Distribution of number of barcodes per each sequence. (b) Replicate-by-replicate correlation of expression (RNA/DNA). Each point represents an active sequence. (c) Simulations of barcode downsampling showing Pearson’s correlation of expression (RNA/DNA) between replicates. Upper panel shows all sequences and lower panel shows sequences with higher expression (RNA/DNA >3). Pearson’s r values are normalized to maximum Pearson’s r observed for each pair of replicates. (d) Box plots of scrambled, positive control, inactive and active sequences. One-sided t-test p-values are shown. Boxes show interquartile range (IQR), black line within box shows median, whiskers show 1.5× IQR from box borders, points show outliers.