. 2021 Apr 22;10:e63713. doi: 10.7554/eLife.63713

Figure 3. Differential activity of derived modern human sequences.

(a–c) Distributions of expression fold-changes (RNA/DNA) of active (light) and differentially active (dark) sequences in each cell type. (d) Overlap of differentially active sequences between cell types. Super Exact test p-value is presented for the overlap of the three groups compared to active sequences. In the 10 sequences that were differentially active across all three cells types, the direction of fold-change was identical across all cell types (p=1.9×10⁻³, binomial test). (e) Violin plots of predicted transcription factor (TF) binding score difference between modern and archaic sequences. Positive scores represent increased binding in the modern sequence. Points show mean.

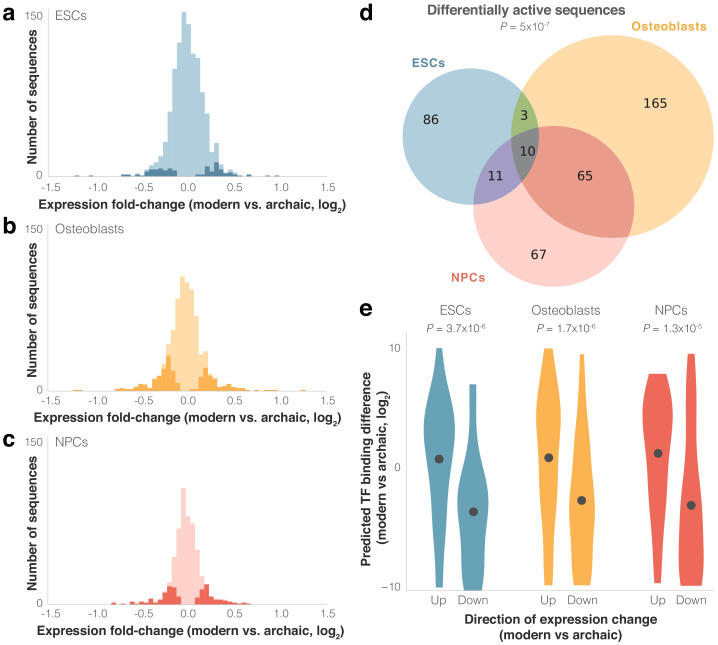
Figure 3.

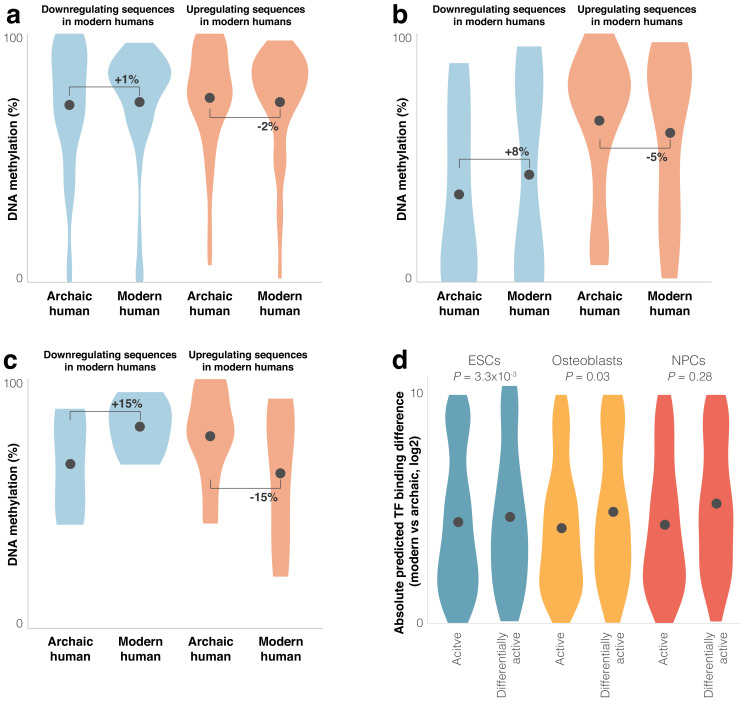
Figure 3—figure supplement 1. Differential activity is associated with differential DNA methylation and transcription factor (TF) binding.

Figure 3—figure supplement 1.

(a–c) Violin plots of DNA methylation levels in modern and archaic human bone methylation samples, for differentially active (a), promoter differentially active (b), and CpG-poor promoter differentially active (c) sequences in osteoblasts. Promoter sequences are sequences between 5 kb upstream and 1 kb downstream of a transcription start site (TSS). CpG-poor promoter sequences were defined as the bottom 50% promoter sequences. (d) Violin plots of absolute predicted TF binding score difference between modern and archaic sequences. Points show mean.
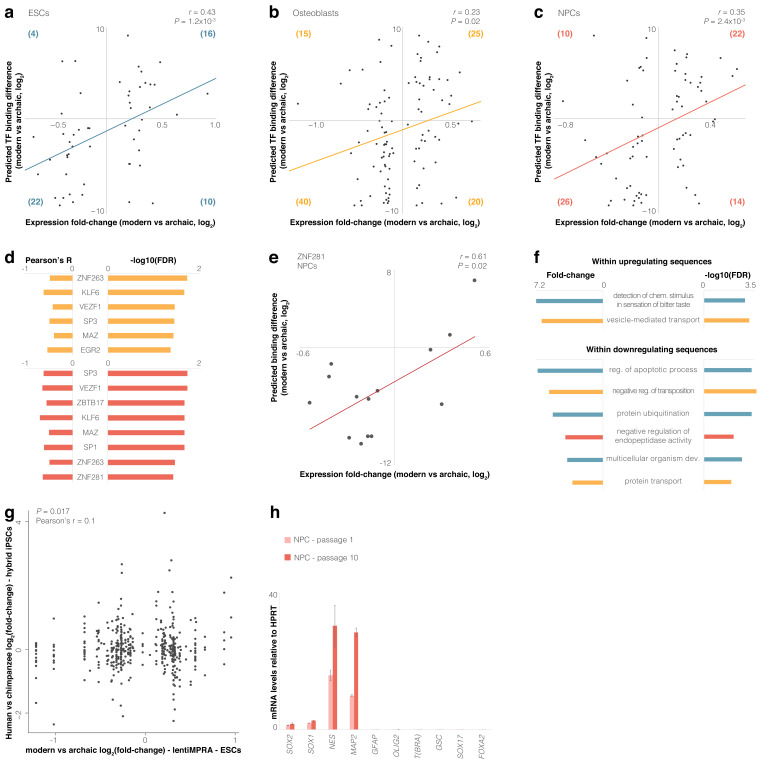
Figure 3—figure supplement 2. Predicted transcription factor (TF) binding is correlated with differential activity.

Figure 3—figure supplement 2.

(a–c) Expression fold-change vs. predicted TF binding fold-change for each sequence. Positive scores represent increased binding in the modern sequence. Parentheses show number of points in each quadrant with a score difference >0. (d) Pearson’s correlation between differential expression and predicted differential binding affinity. Only significant TFs (false discovery rate [FDR] ≤0.05, Supplementary file 3) are shown for osteoblasts (yellow) and neural progenitor cells (NPCs) (red). (e) Expression fold-change vs. predicted TF binding fold-change for ZNF281 in NPCs. Pearson’s r and p-value are shown. (f) Enriched Gene Ontology terms for embryonic stem cells (ESCs) (blue), osteoblasts (yellow), and NPCs (red). (g) Expression fold-change of differentially active sequences compared to the cis-regulatory expression fold-change between human and chimpanzee of genes associated with these sequences. cis-regulatory expression changes were taken from hybrid human-chimpanzee induced pluripotent stem cells (iPSCs) (Gokhman et al., 2021). (h) RT-qPCR validation of NPCs at passage 1 (pink) and passage 10 (red). Expression levels are normalized to HPRT expression.