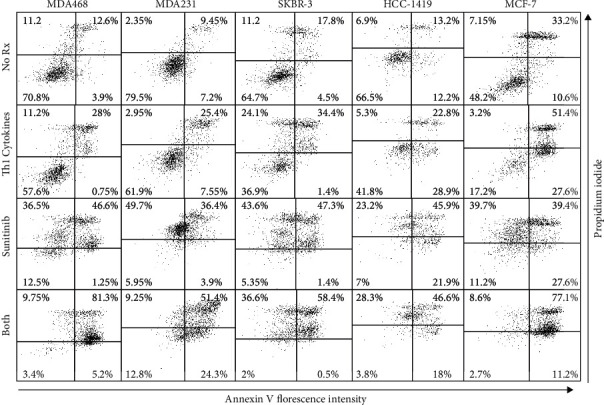
Figure 3.

Combination of Th1 cytokines and sunitinib maximizes markers of apoptosis in breast cancer cell lines. MDA-MB-468, MDA-MB-231, SKBR-3, HCC-1419, and MCF-7 cells were seeded at 5 × 10⁴ per mL and were left either untreated (No Rx) or treated with Th1 cytokines (5 ng/mL), sunitinib (10 μM), or sunitinib and Th1 cytokines (both) for 72 hours. Cells were then harvested and stained with FITC-Annexin V and propidium iodide (PI), and stain uptake was assessed by flow cytometry. Two-color dot plot analysis displays the percentage of cells in each quadrant. Double-stained cells (upper right quadrants) indicate late apoptotic events. Dot plots shown are from one representative experiment of three total showing similar results.
