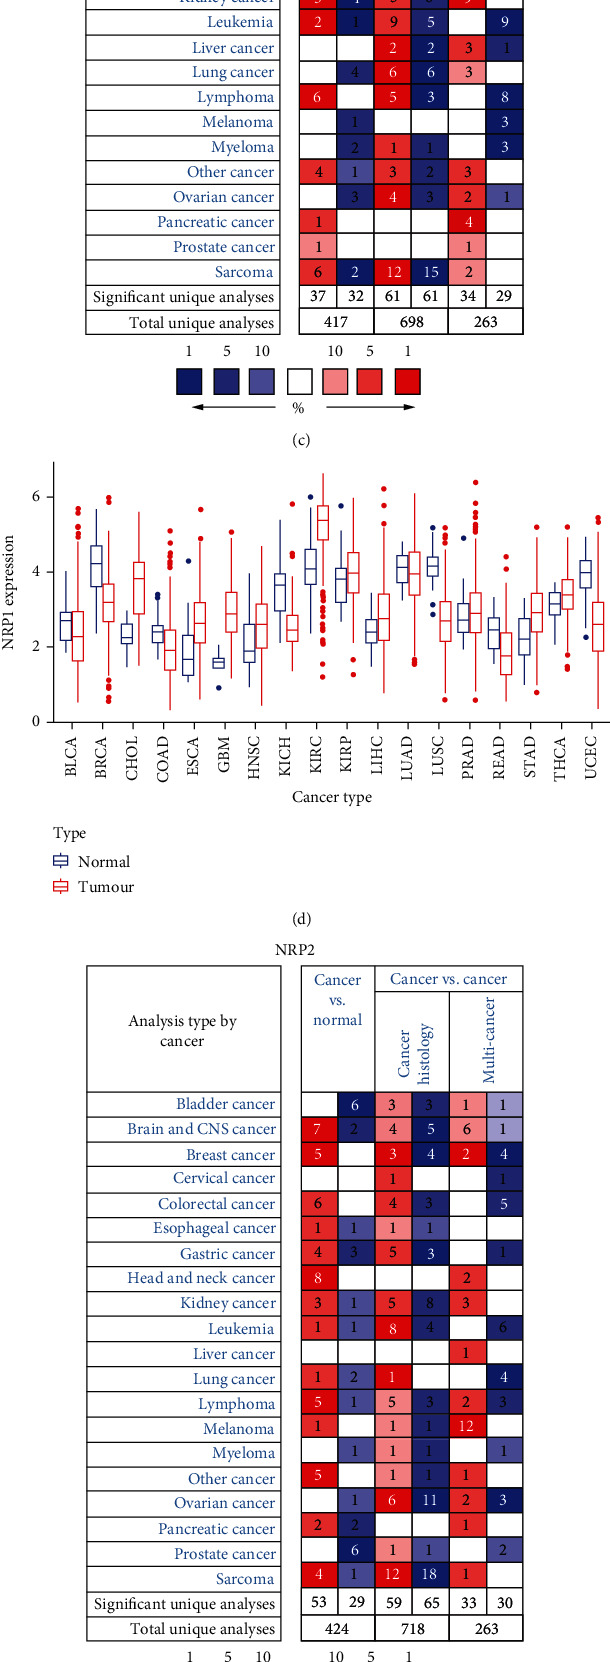
Figure 2.

NRP1 and NRP2 mRNA levels in pancancers. (a) NRP1 and NRP2 expression levels in human tissues. Darker colours indicate higher levels of expression. (b) Overall expression of NRP1 and NRP2 in human tissues. (c) Differential in NRP1 expression in cancer and normal tissues in the Oncomine database. The number in each small rectangle represents the number of high or low expression of NRP genes in each cancer. Red (high expression) and blue (low expression) shading indicates the proportion in each cancer tissue. (d) Box plots from TCGA's database demonstrating differential expression of NRP1 expression in different tumour and normal samples. (e) Differential expression of NRP2 expression in cancer and normal tissues in the Oncomine database. (f) Box plots from TCGA's database demonstrating differential expression of NRP2 expression in different tumour and normal samples.
