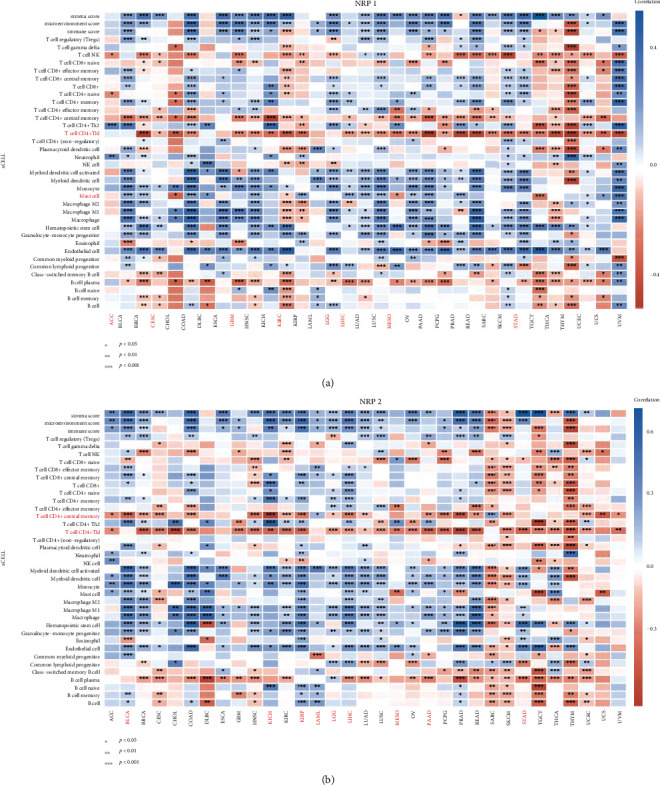
Figure 6.

Heat map of Spearman correlation analysis between the xCell/EPIC immune score and the NRP family gene expression in multiple tumour tissues, where the horizontal axis represents different tumour tissues, the vertical axis represents different immune scores, different colours represent correlation coefficients, negative values represent negative correlation, and positive values represent positive correlation (∗p < 0.05, ∗∗p < 0.01, ∗∗∗p < 0.001). Significance of the two sample groups by Wilcoxon test.
