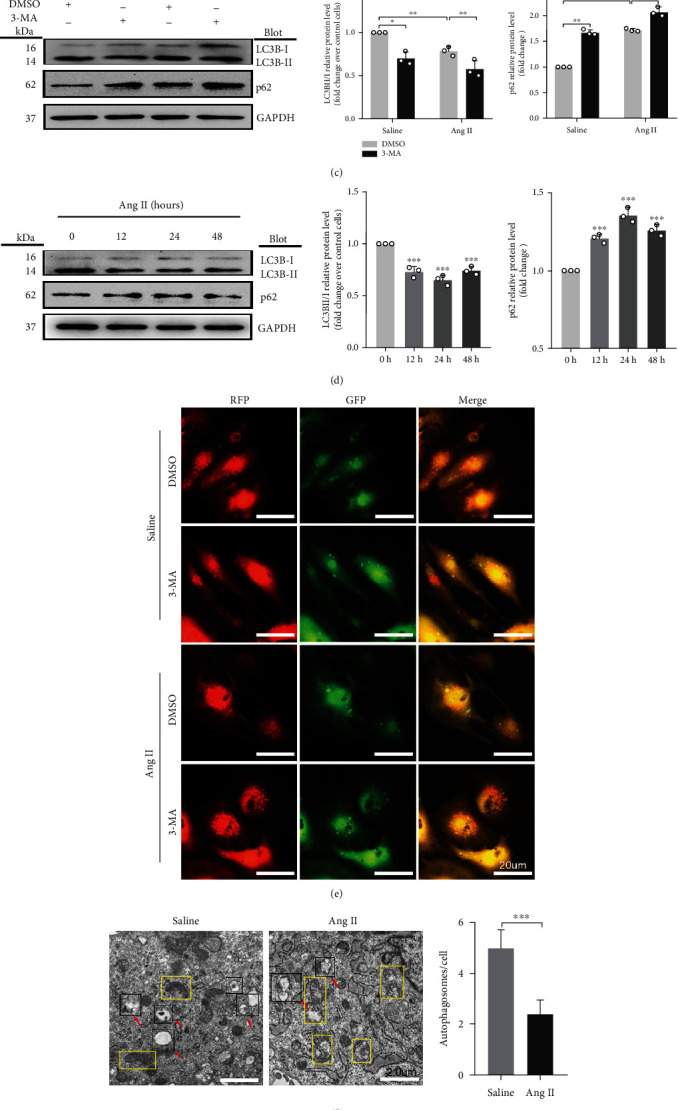
Figure 1.

Ang II induces hypertrophy, oxidative stress, and apoptosis and inhibits autophagy in cardiomyocytes. (a) Cardiomyocyte surface area determined by immunofluorescence staining. Scale bar: 50 μm, n = 25. (b) Relative mRNA levels of ANF and BNP in Ang II- and vehicle-treated cardiomyocytes, determined using qRT-PCR. (c) Western blot analysis for the expression of LC3B and p62 in cardiomyocytes treated with 3-MA. (d) Western blot analysis for the expression of LC3BII/I and p62 in cardiomyocytes treated with Ang II at different time points. (e) NRCMs infected with adenovirus mRFP-GFP-LC3 and analyzed using a fluorescence microscope. Scale bar: 20 μm. (f) Autophagy activity assessed using TEM, with red arrows indicating autophagy lysosome or autophagosome and the yellow boxes indicating mitochondria. Scale bar: 2.0 μm. (g) ROS production in cardiomyocytes quantified by DHE fluorescent dyes. Scale bar: 50 μm. (h) Apoptosis levels measured by TUNEL staining. Red: apoptotic cells; blue: nuclei DAPI staining. Scale bar: 100 μm. ∗P < 0.05 and ∗∗P < 0.01. All results are the mean ± SEM of three independent experiments (n = 3).
