
Figure 5.
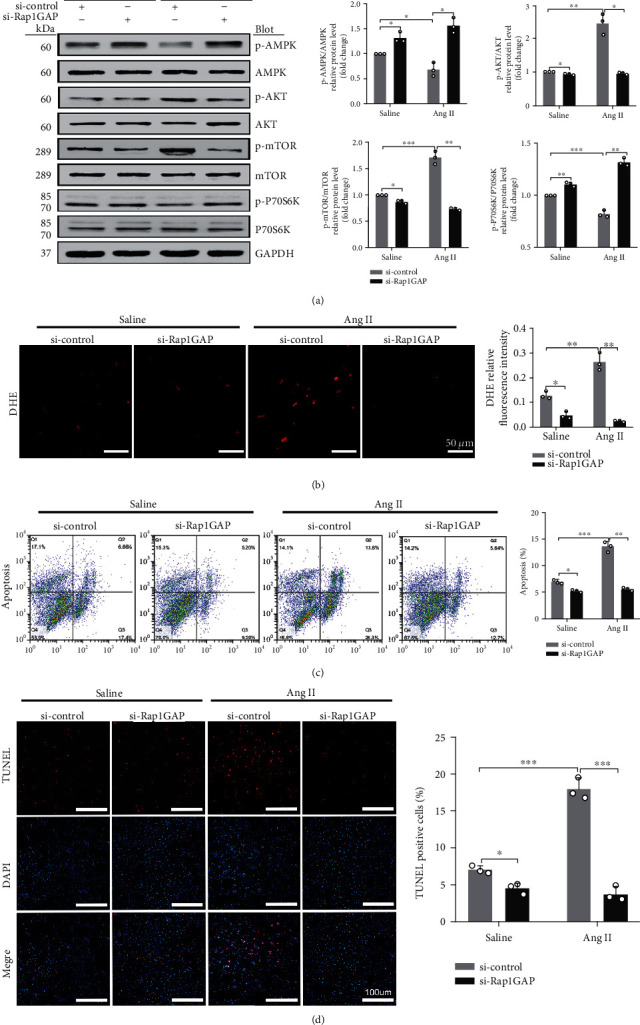
Rap1GAP knockdown inhibited Ang II-induced ROS production and apoptosis. (a) Phosphorylated protein and total protein expression of AMPK, AKT, mTOR, and p70s6K in Rap1GAP knockdown vs. control cardiomyocytes. (b) ROS production in Rap1GAP knockdown and intact cardiomyocytes evaluated using DHE fluorescent dyes. Scale bar: 50 μm. (c) Flow cytometric analysis for NRCM apoptosis stained with 7AAD and Annexin V-PE. In the coordinate system, X axis is 7AAD, and Y axis is Annexin V-PE. (d) TUNEL staining for cardiomyocyte apoptosis assay. Scale bar: 100 μm. ∗P < 0.05 and ∗∗P < 0.01. Data are the mean ± SEM of three independent experiments (n = 3).