Figure 6.

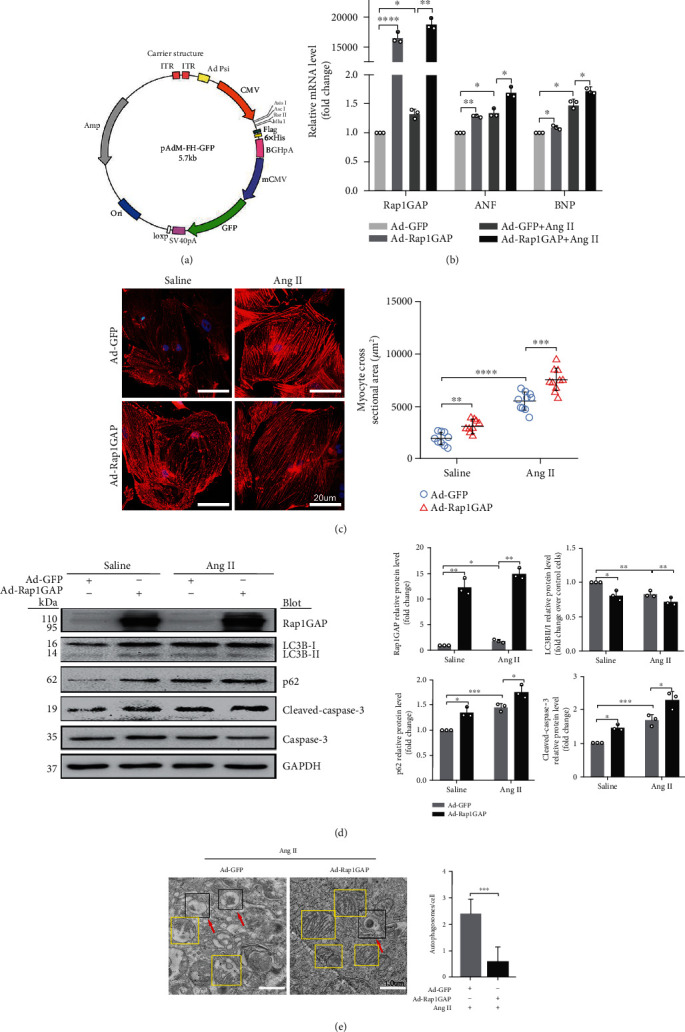
Rap1GAP overexpression aggravates cardiomyocyte hypertrophy and further inhibits Ang II-induced autophagy. (a) The structure of the construct of expression plasmid. (b) mRNA levels of Rap1GAP, ANF, and BNP in Rap1GAP overexpressing and intact cardiomyocytes determined using RT-PCR. (c) Representative images and quantification from α-actinin staining showing cardiomyocyte surface area in Rap1GAP overexpressing and intact cardiomyocytes. Scale bar: 20 μm; n = 10. (d) Western blot analysis for LC3BII/I, p62, and cleaved-caspase-3/caspase-3 in Rap1GAP overexpressing and intact cardiomyocytes. (e) Representative images and quantifications from TEM showing autophagy lysosomes, autophagosomes, and mitochondria. The red arrows indicate autophagy lysosome or autophagosome, and the yellow boxes indicate mitochondria. Scale bar: 1.0 μm. ∗P < 0.05 and ∗∗P < 0.01. Results are the mean ± SEM of three independent experiments (n = 3).
