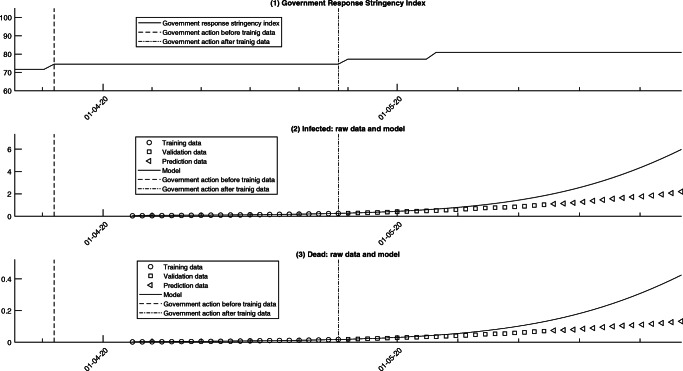
Fig. 2.
Plots of (1) Government Response Stringency Index in Brazil. Time chart on a scale of 0 to 100 (source: [27]), (2) cumulative infected for 1000 inhabitants and (3) cumulative deaths for 1000 inhabitants of COVID-19 versus predictions from the model for Brazil

