
Figure 4:
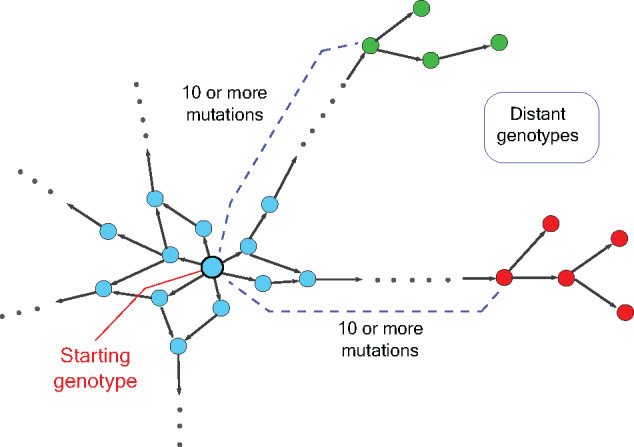
A schematic genotype map encompassing large mutational distances. The network shows nodes representing genotypes with different phenotypes denoted by different colours. Edges connect nodes (genotypes) that can be reached by one mutation. The distant genotypes can be reached after 10 or more mutations from the starting genotype.