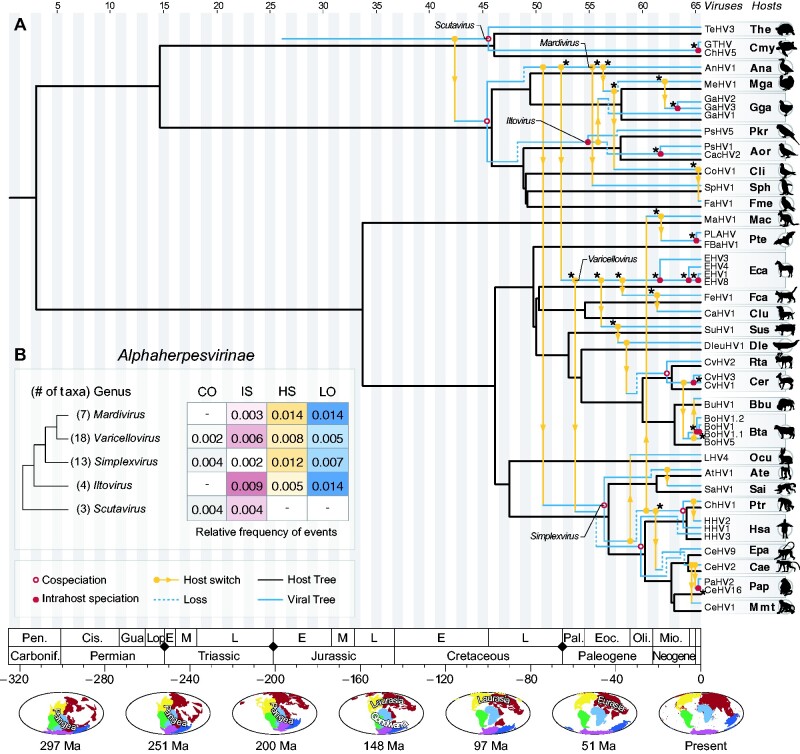
Figure 4.
Tree reconciliation of alphaherpesviruses and their hosts. (A) In this representation, the host tree is shown in black, and the viral tree is shown in blue and yellow, twisted while keeping its original topology, with its nodes assigned to time zones, as shown in Fig. 2. Cophylogenetic events found in more than 90 per cent of the cost regimes employed in this study are marked with an asterisk (*) (see Supplementary Fig. S3). (B) Relative frequency of cophylogenetic events in distinct genera of Alphaherpesvirinae, considering the optimal cost regime (see Supplementary Table S3). The frequencies represent the number of events normalized by the total number of taxa in each genus, and by their respective TMRCA. Along the time scale at the bottom, black diamonds denote major events of mass extinction, as described in (Raup 1993). The maps show changes of landmasses (continental drift) over time, and were retrieved from Paleobiology Database (PBDB) (Peters and McClennen 2016). Cis. = Cisuralian; E = Early; Eoc. = Eocene; Gua. = Guadalupian; L = Late; Lop. = Lopingian; M = Middle; Mio. = Miocene; Oli. = Oligocene; P = Pliocene; Pal. = Paleocene; Pen. = Pennsylvanian.

