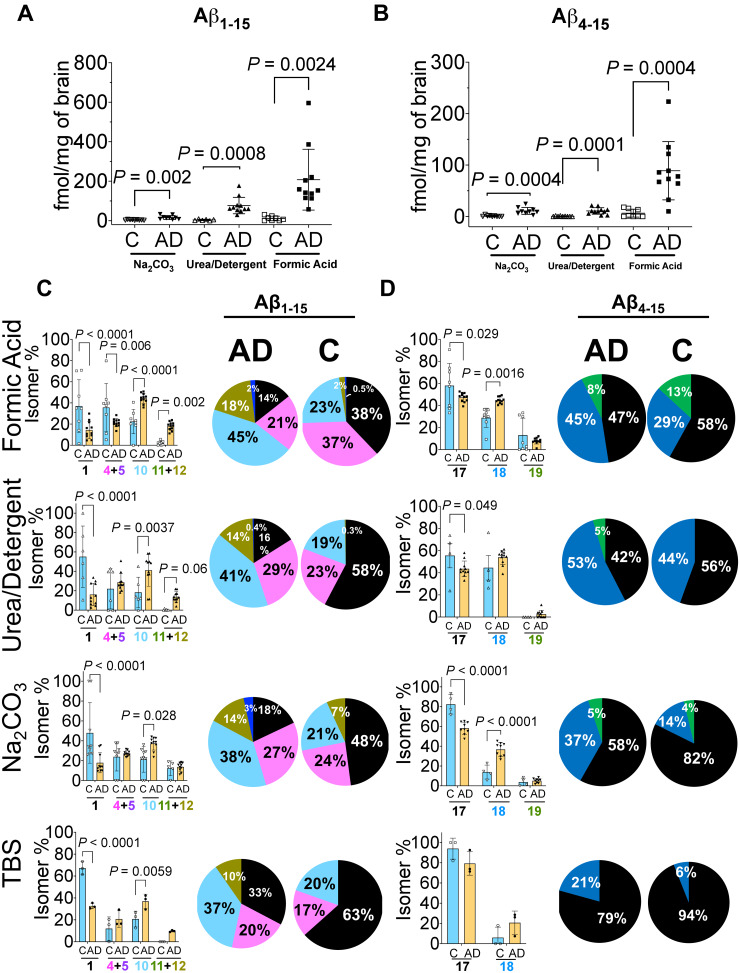
Figure 3.
Quantitation of amyloid-β N-terminus isomers. Scatter plots for the absolute quantitation of the N-terminus of Aβ peptides (A) total Aβ1–15 and (B) total Aβ4–15 in the three amyloid rich biochemical fractions of Na2CO3, urea-detergent and formic acid. Aβ peptides were compared between Alzheimer’s disease (n = 11) and control (n = 9) using mass spectrometry. The total levels of Aβ1–15 and Aβ4–15 are significantly elevated in Alzheimer’s disease tissue in all biochemical fractions. (C) Percentage ratio of most abundant Aβ1–15 isomers and (D) Aβ4–15 isomers in Alzheimer’s disease compared to control brains across different biochemical fractions. The unmodified Aβ1–15 (native) is significantly decreased in all the biochemical fractions while doubly isomerized 1-iso, 7-iso-Asp Aβ1–15 (10) diastereomer is significantly increased. The Aβ4–15 isomer ratios demonstrated statistically significant changes in FA and Na2CO3 fractions. The pie charts summarize the pattern of distribution of isomerization of Aβ1–15 and Aβ4–15 in the different biochemical fractions. All the values are mean ± SD; significance in total Aβ1–15 and Aβ4–15 was determined by unpaired t-test with equal variance, while for the total amount of the Aβ1–15 and Aβ4–15 isomers and their normalized ratios, adjusted p values were calculated with ANOVA as described in the Materials and methods section. AD = Alzheimer’s disease; C = control, individual isomers of Aβ1–15 and Aβ4–15 are numbered according to Fig. 2.

