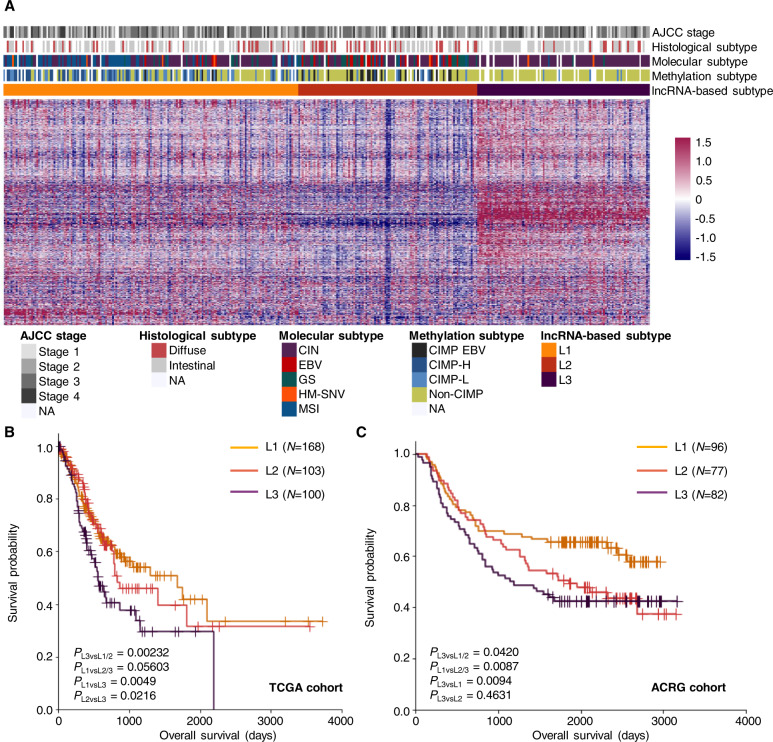
Fig. 1. Molecular classification based on tumor-specific lncRNA expression defined novel GC subtypes with prognostic value.
A Heatmap of differentially expressed lncRNAs in three GC subtypes. Each column represented one GC sample, and each row represented a lncRNA. The AJCC stage, histology, molecular subtype, and methylation-based subtype for each sample were marked on the top panel, with a white grid representing non-available (NA) information. B, C Kaplan–Meier curve illustrating the overall survival for GC patients of the three subtypes from the TCGA (B) and ACRG (C) cohort. P-values were calculated by log-rank test.

