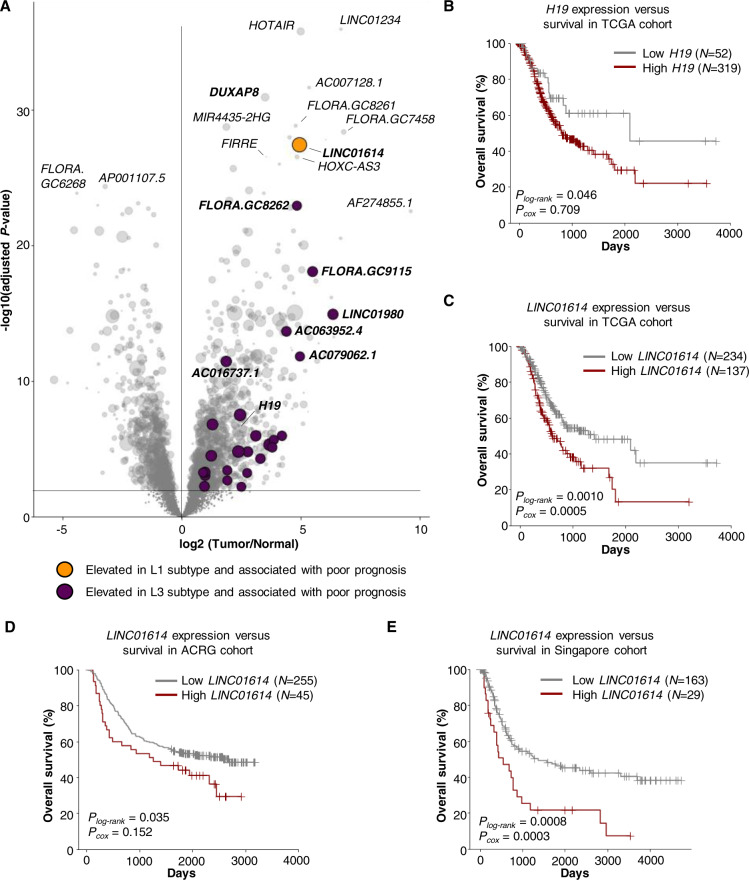
Fig. 4. Identification and prioritization of noncoding prognostic markers for gastric cancer.
A Volcano plot of differentially expressed lncRNAs between tumor and normal samples in TCGA. The lncRNAs that were significantly upregulated in L3 and L1 were highlighted and colored purple and yellow, respectively. The lncRNAs that were upregulated in tumors and correlated with unfavorable prognosis were enlarged, with dot size proportional to −log10(P-value) of Cox regression test. B Expression of H19 was associated with unfavorable prognosis in the TCGA cohort. C–E Expression of LINC01614 was associated with unfavorable prognosis in the TCGA (C), ACRG (D), and Singapore cohort (E). The cut-off for defining the high expression group and low expression group were selected to maximize the survival difference (with the minimum P-value by log-rank test (Plog-rank) of all cut-off values tested). Pcox was calculated by the Cox regression test.

