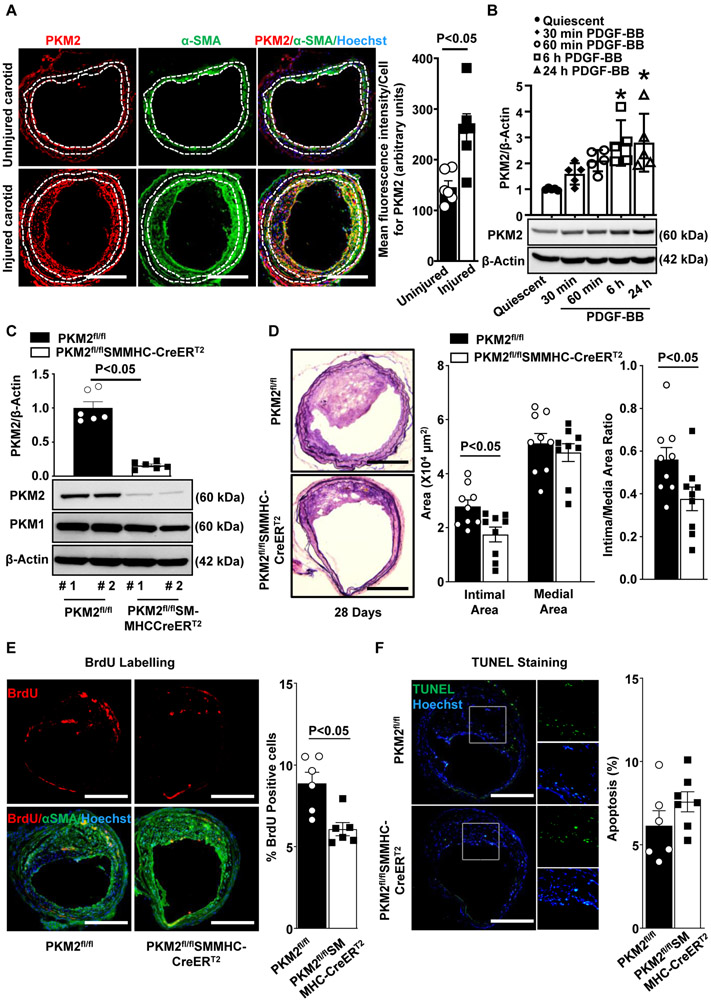
Figure 1. PKM2 is expressed in neointimal SMCs and mediates neointimal hyperplasia in mice.
A, The left panels show representative images showing double immunostaining for PKM2 (red) and αSMA (green) in the uninjured and injured carotid artery of wild-type mice harvested after 28 days of injury (n = 6/group). Nuclei are counterstained with Hoechst (blue). Scale bars: 200 μm. The right panel shows the quantification of the PKM2 fluorescence intensity. B, Representative immunoblots and densitometric analysis of PKM2 expression levels in serum-deprived mouse aortic SMCs stimulated with or without PDGF-BB for indicated time points. β-actin was used as a loading control. n = 4/group. C, Immunoblot analysis of PKM2, PKM1, and β-actin in SMC isolated from PKM2fl/fl and PKM2fl/fl-SMMHCCreERT2 mice treated with tamoxifen. #1 and #2 represents samples from two individual mice. D, The left panels show representative photomicrographs of Verhoeff’s van Gieson stained carotid artery sections from PKM2fl/fl and PKM2fl/flSMMHC-CreERT2mice after 28 days of the injury. n = 9/group. Scale bars: 200 μm. The right panels show quantification of intimal area, medial area, and a ratio of intimal to the medial area. Each dot represents a single mouse. E, The left panels show representative BrdU-positive cells (green) counterstained with αSMA (red) and Hoechst (blue). The right panel shows the quantification of percent BrdU-positive cells. Scale bars: 200 μm; n = 6/group. F, The left panels show representative TUNEL-positive cells (green) counterstained with Hoechst (blue). The right panel shows the quantification of TUNEL-positive cells. Scale bars: 200 μm; n = 6/group. Values are represented as mean ± SEM. Statistical analysis: B, One-way ANOVA followed by Bonferroni's post hoc test; A, C, D, E, and F, unpaired Student's t-test. *P < 0.05 versus quiescent.

