
Figure 6:
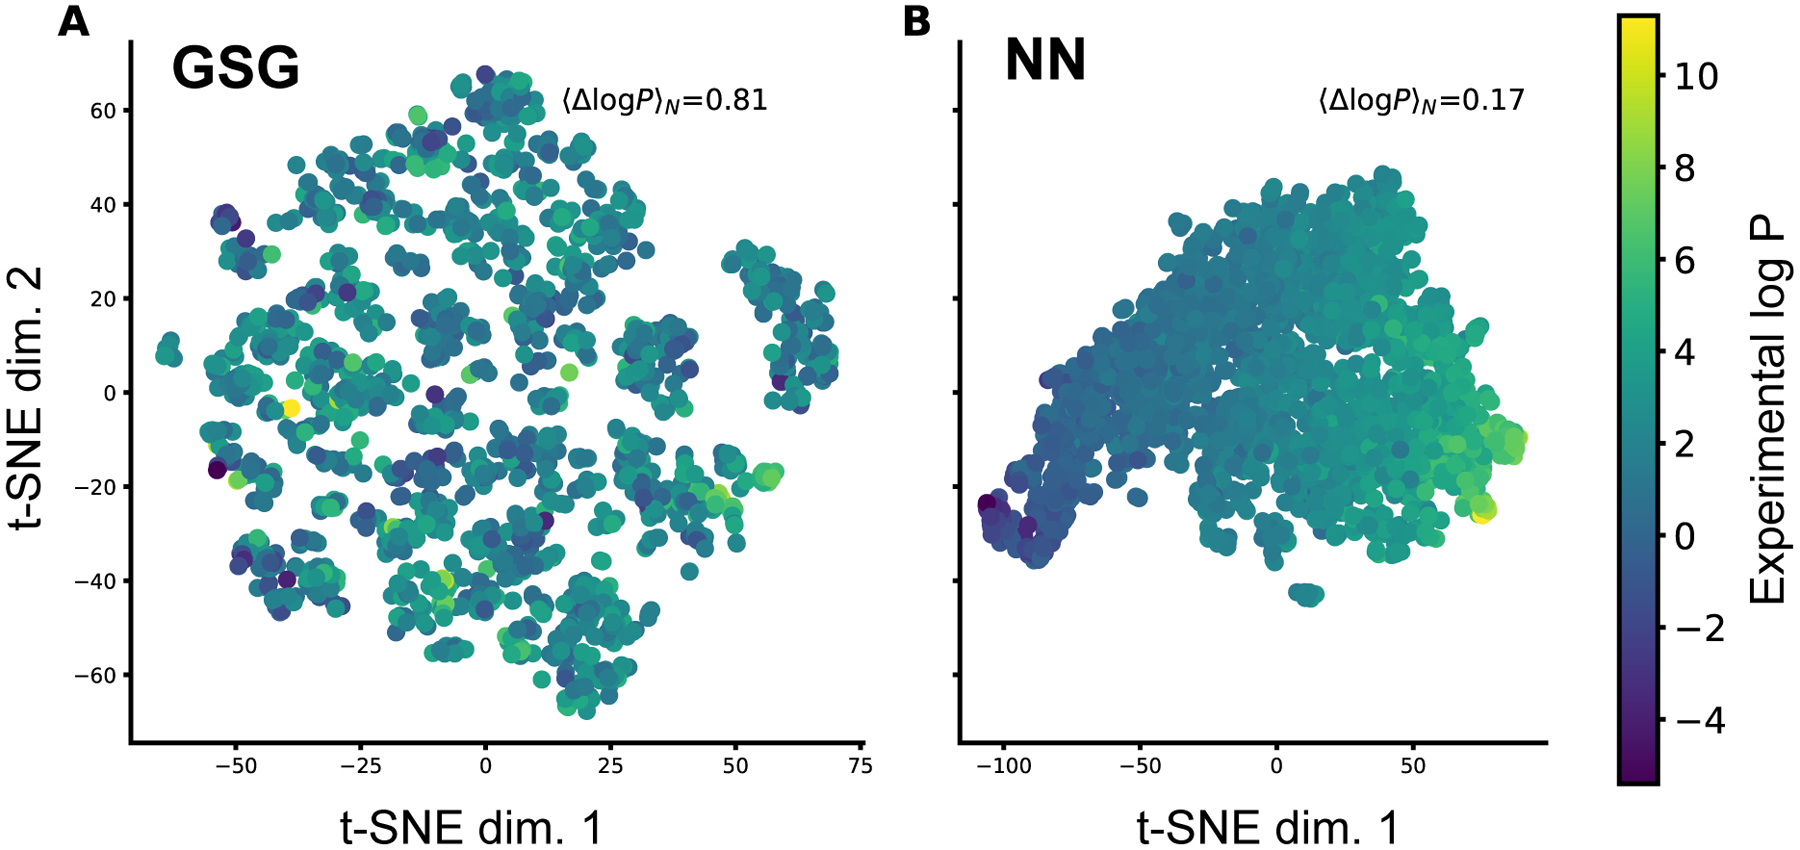
The t-SNE plots with GSG and NN features of the OpenChem test set molecules. Each represents a molecule and is colored by its actual log P value. 〈Δlog P〉N shows the mean log P difference value calculated over the nearest neighbors in the t-SNE plot. A) The GSG features of size 1716 are projected into 2-dimensional space. B) The NN features from the last hidden layer with size of 400 are projected into 2-dimensional space.