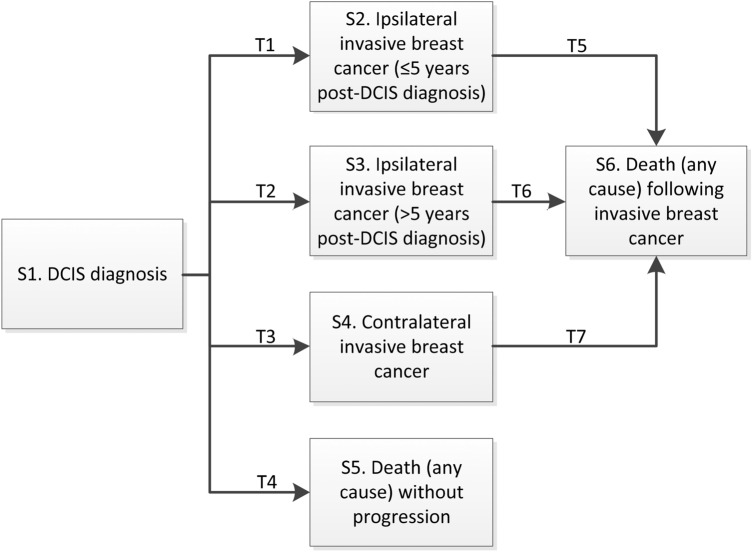
Fig. 2.
Multi-state model structure. The multi-state model structure includes six mutually exclusive health states (S1–S6) each represented by a box, and the seven transitions between each state (T1–T7). Arrows represent all possible transitions between states which were modelled. Transitions between states were modelled using multivariate Cox proportional hazards models, which assessed the impact of patient and treatment characteristics on the hazard (risk) of each event (i.e. transition from one health state to another)

