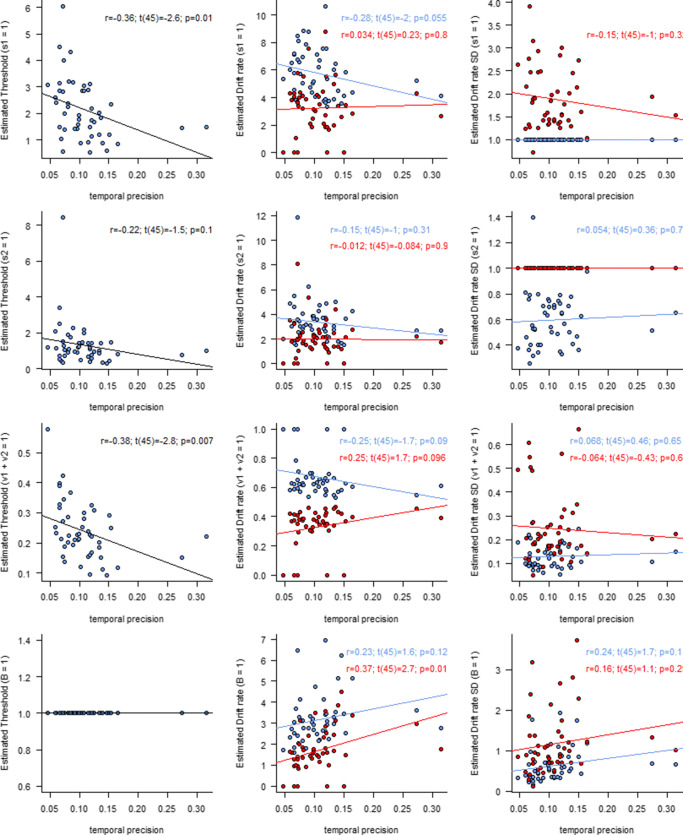
Fig. 4.
Correlations between estimated linear ballistic accumulator (LBA) model parameters and temporal precision in a secondary task. Left panels: Threshold parameter B. Middle panels: Mean drift rates for correct (blue, v1) and incorrect (red, v2) responses. Right panels: Standard deviation of drift rates for correct (blue, s1) and incorrect (red, s2) responses. Each row is scaled differently (indicated between brackets on the y-axis). The statistics are the results of correlation tests on the LBA parameter and temporal precision from Miletić and van Maanen (2019), suggestive of the different conclusions that might have been drawn if different scaling assumptions would have been made

