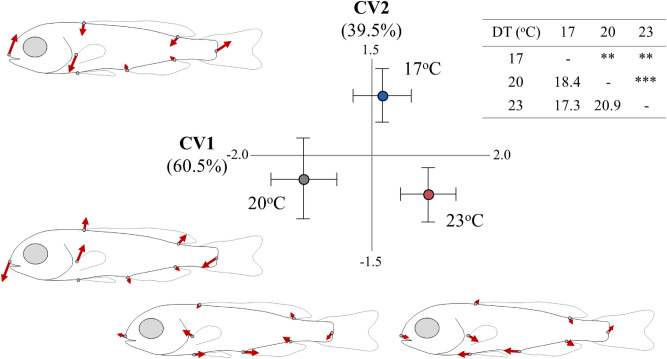
Figure 3.
Effect of developmental temperature (17, 20, 23 °C) on the body-shape of seabream metamorphosing larvae. Means (± 2SE) of the canonical scores are given. Numbers in brackets are equal to the percentage of shape variance explained by each canonical variate (CV) axis. Vector diagrams demonstrate the components of shape change relative to the extreme values of CV axes. Squared Mahalanobis distances between the different groups and the respective significance levels are given in the table next to CVA graph. **p < 0.01; ***p < 0.001.

