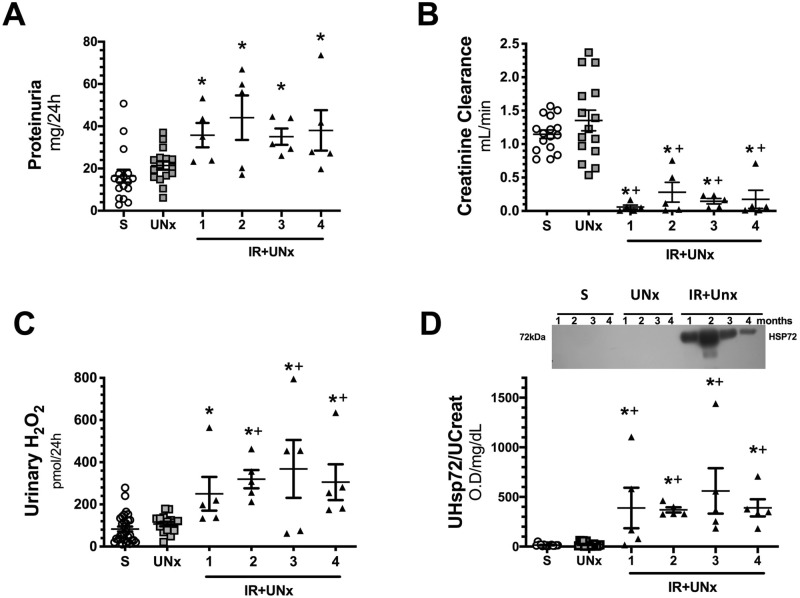
Figure 1.
Renal injury induced by unilateral ischemia after 24 h of reperfusion. (A) Proteinuria, (B) Creatinine clearance, (C) Urinary hydrogen peroxide, and (D) Urinary HSP72 corrected by urinary creatinine, including a representative cropped blot image. Data are represented as the mean ± SE (for S, n = 16, for UNx, n = 16 and n = 20 for IR + UNx groups). White bars represent the S, gray bars represent UNx, and black bars represent IR + UNx groups. The one-way analysis of variance (ANOVA) was used to determine statistical differences, using the Bonferroni correction for multiple comparisons. *p < 0.05 versus S group and + p < 0.05 versus UNx group. Full-length blots are presented in Supplementary Fig. 3.

