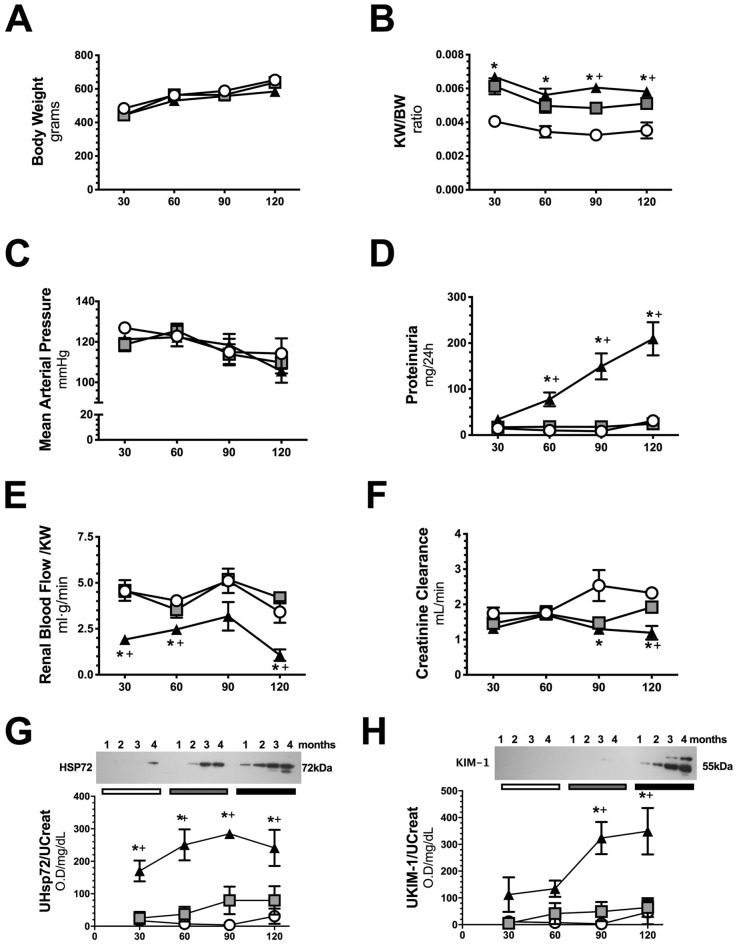
Figure 2.
Follow-up of renal function in the AKI to CKD transition. (A) Body weight, (B) Ratio kidney weight/body weight, (C) Mean arterial Pressure, (D) Proteinuria, (E) Renal blood flow / kidney weight, (F) Creatinine clearance, (G) Urinary HSP72 corrected by urinary creatinine, and (H) Urinary KIM-1 corrected by urinary creatinine, including representative cropped blots, along the follow-up. Data are represented as the mean ± SE. n = 4, 4, and 5 for the S, UNx, and IR + UNx groups in each studied period: 30, 60, 90, and 120 days post-ischemia. White circles represent the S, gray squares represent UNx and black triangles represent IR + UNx groups. The one-way analysis of variance (ANOVA) was used to determine statistical differences, using the Bonferroni correction for multiple comparisons. *p < 0.05 versus S group and + p < 0.05 versus UNx group in their respective period. Full-length blots are presented in Supplementary Figs. 4 and 5.

