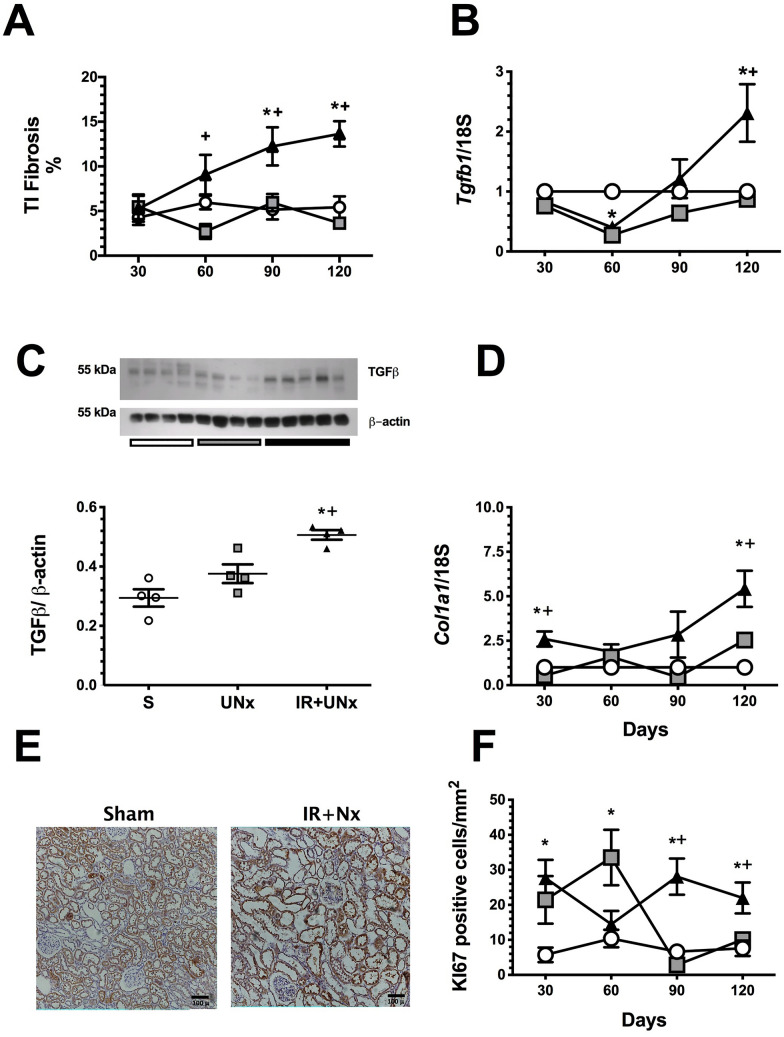
Figure 3.
Temporally induction of tubulointersticial fibrosis by TGFβ activation. (A) Tubulointersticial fibrosis, (B) mRNA levels of Tgfb1, (C) Protein levels of TGFβ, at fourth-month post-ischemia, including a representative cropped blots. (D) mRNA levels of Collagen1a1, (E) Representative microphotographs of Ki67 immunostaining for the S and IR + UNx groups. (F) Quantification of Ki67 positive epithelial cells (cells/mm2). Data are represented as the mean ± SE. n = 4, 4, and 5 for S, UNx, and IR + UNx groups, in each studied period: 30, 60, 90, and 120 days post-ischemia. White circles/bar represent the S, gray squares/bar represent the UNx and black triangles/bar represent the IR + UNx groups. The one-way analysis of variance (ANOVA) was used to determine statistical differences, using the Bonferroni correction for multiple comparisons. *p < 0.05 versus S group and + p < 0.05 versus UNx group in their respective period. Full-length blots are presented in Supplementary Fig. 6.

