Figure 5.
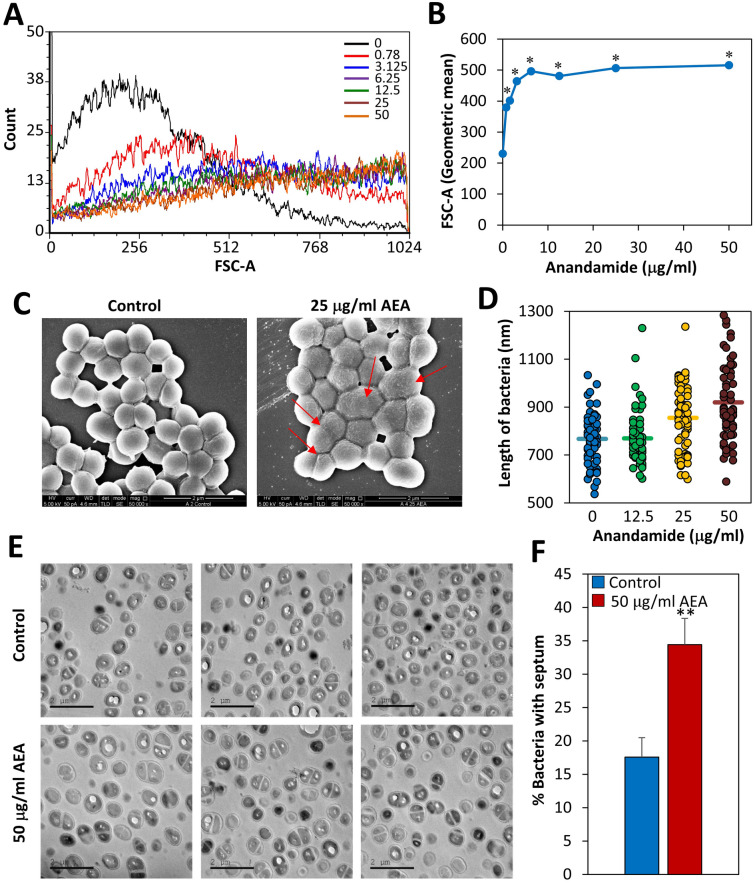
AEA changes the structure of the bacteria and increases the number of bacteria with complete septum. (A) Forward scatter on flow cytometry of bacteria treated with various concentrations of AEA for 2 h. (B) The graph shows the mean geometric FSC of data presented in (A). (C) SEM images of control bacteria or bacteria treated with 25 μg/ml AEA for 2 h. The red arrows point to bacteria that are larger and seem to be in division, but did not yet separate. The AEA-treated bacteria show ruffled membranes, which is in contrary to the control bacteria with smooth membranes. (D) The length of the bacteria after a 2 h treatment with AEA compared to control bacteria. n = 65–70 for each treatment group measured from 4–5 independent images. The horizontal lines present the average size. The y axis is set within the range of the cell sizes. (E) TEM images of control and AEA-treated bacteria for 2 h. (F) The graph presents the percentage of bacteria showing complete septum. 840–890 bacteria were counted in 6 different images of each sample. **p < 0.002.

