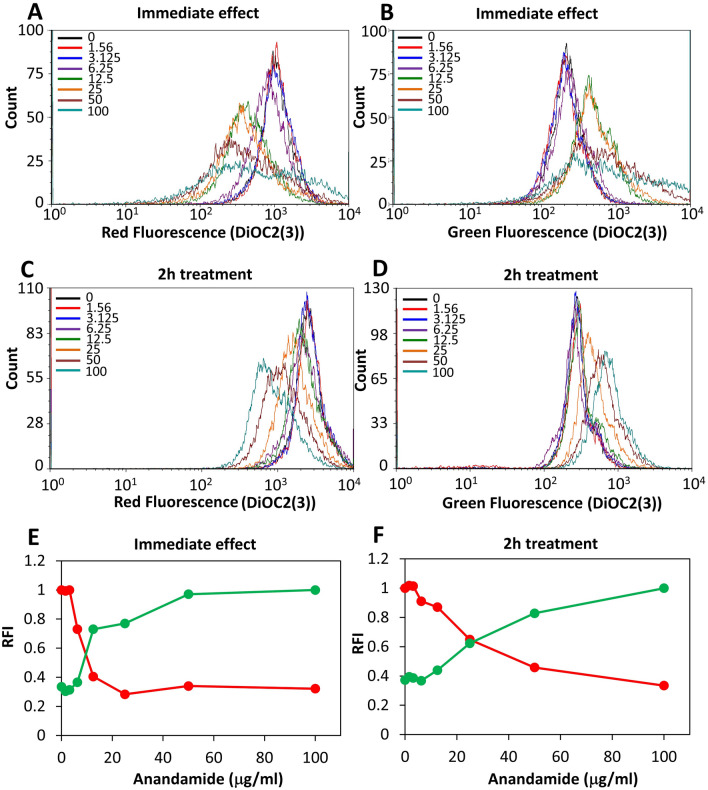
Figure 8.
AEA causes an immediate drop in membrane potential that was partially relieved after 2 h. (A–D) The membrane potential was measured using the DiOC2(3) dye on flow cytometry immediately after adding AEA (A,B) and after 2 h treatment with AEA (C,D). Red fluorescence is an indication for the strength of the membrane potential. (E,F) are summaries of the relative fluorescence intensity (RFI) of the red (red lines) and green (green lines) fluorescence for the immediate AEA effect (E) and after 2 h treatment with AEA (F).

