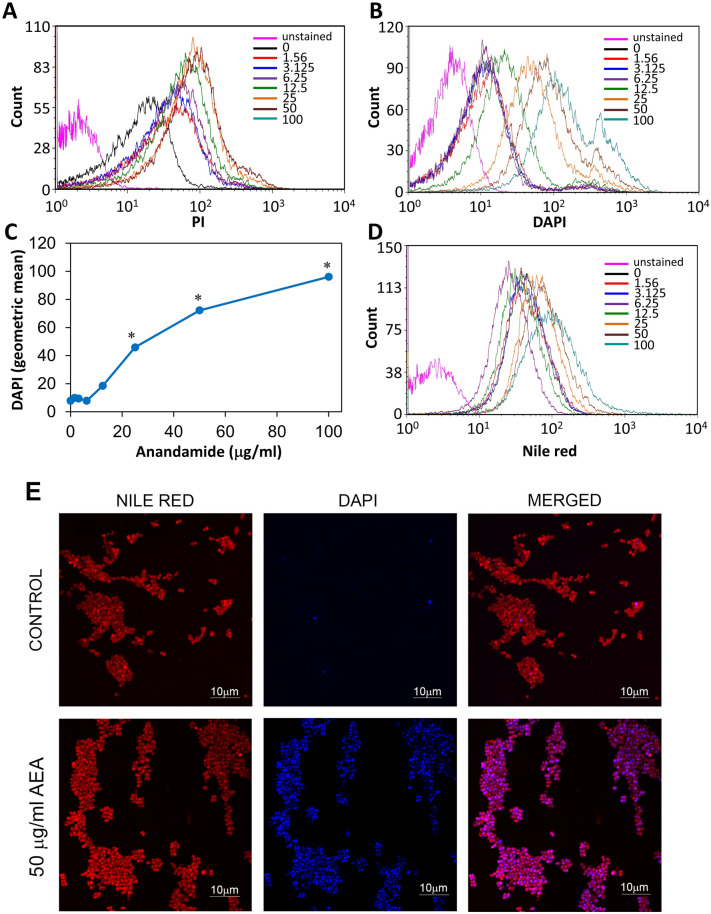
Figure 9.
AEA leads to a dose-dependent accumulation of DAPI. (A) Propidium iodide (PI) uptake of MDRSA CI-M treated with increasing concentrations of AEA for 2 h as determined by flow cytometry. (B) DAPI uptake of MDRSA CI-M treated with increasing concentrations of AEA for 2 h as determined by flow cytometry. (C) A summary of the geometric mean fluorescence intensity of DAPI accumulation in the AEA-treated bacteria presented in B. (D) The fluorescence intensity of nile red membrane staining of control and AEA-treated bacteria as determined by flow cytometry. (E) Spinning disk microscopy of control and 2 h AEA-treated MDRSA CI-M that were stained with nile red (red fluorescence) and DAPI (blue fluorescence). *p < 0.05.

