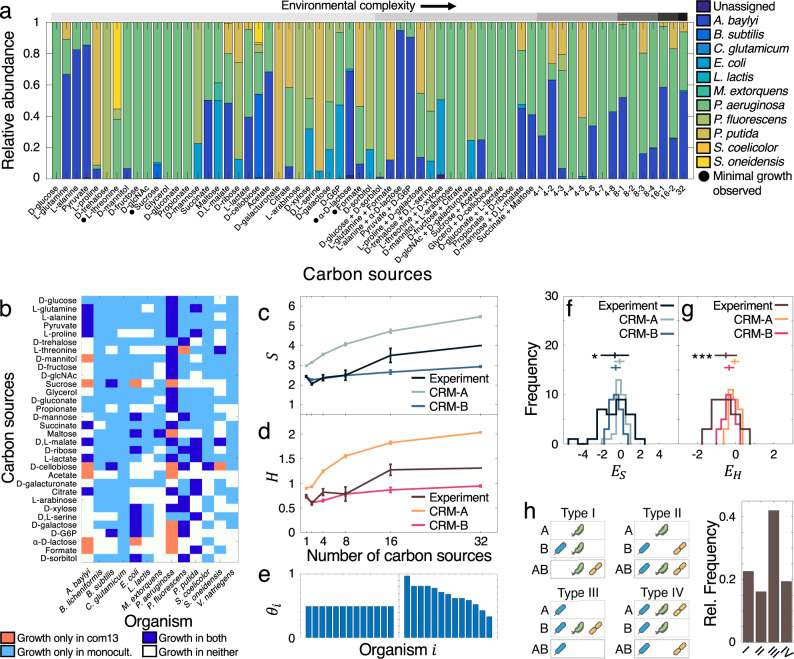
Fig. 3. Endpoint taxonomic properties of 13-species community in up to 32 carbon sources (com13).
a Mean species relative abundances across three biological replicates. Environments with more than two carbon sources are abbreviated (e.g., condition 4–1 contains the carbon sources in the first two 2-carbon source conditions, etc.). For complete environmental compositions see Supplementary Table 3. Gray circles indicate community growth below OD600 0.05. Initial compositions and compositions across all replicates are found in Supplementary Fig. 13a. b Species-specific differences in growth between single-carbon source monoculture (Supplementary Fig. 9a) and single-carbon source community contexts. c, d Comparison of observed community species richness S (c) and Shannon entropy H (d) with phenotypes predicted by consumer resource models. The resource utilization capabilities of simulated organisms are either the same on average (CRM-A), or variable allowing for generalists and specialists (CRM-B). Data are represented as mean ± SEM. No significant increases in S or H were identified when comparing the single-carbon source cases to the 32-carbon source cases (one-tailed paired t-test p = 0.107 for S and 0.180 for H). e Representation of the fraction θ of resources usable by each organism i. Left: in CRM-A, each organism has the same low probability of consuming a given resource, resulting in low levels of niche overlap ρ = 0.37 ± 0.07. Right: in CRM-B, this probability varies for each organism, determined by the fraction of carbon sources that were consumed by each organism in our monoculture experiments (Supplementary Fig. 9a). The composition of CRM-B communities resulted in higher degrees of niche overlap (ρ = 0.50 ± 0.09). Organisms are displayed by decreasing θ. f, g Distributions of species richness epistasis (ES, f) and Shannon entropy epistasis (EH, g) scores for experiment and CRM. Upper bars denote mean and standard deviation. Significance values are calculated against the distributions for CRM-A using a one-sided t-test and are indicated by (*) p < 0.05 and (***) p < 0.001 (p = 0.034 for ES and 1.26 × 10⁻⁴ for EH). h Schematic and prevalence of different epistasis types. Illustrations are representative examples. Type I: The environment AB results in the presence of an organism not observed in either environment A or B; Type II: AB results in the union of organisms from A and B; Type III: AB contains only the organisms from the lowest-diversity environment; Type IV: AB results in a more complex pattern of diversity loss. Source data are provided as a Source Data file.

