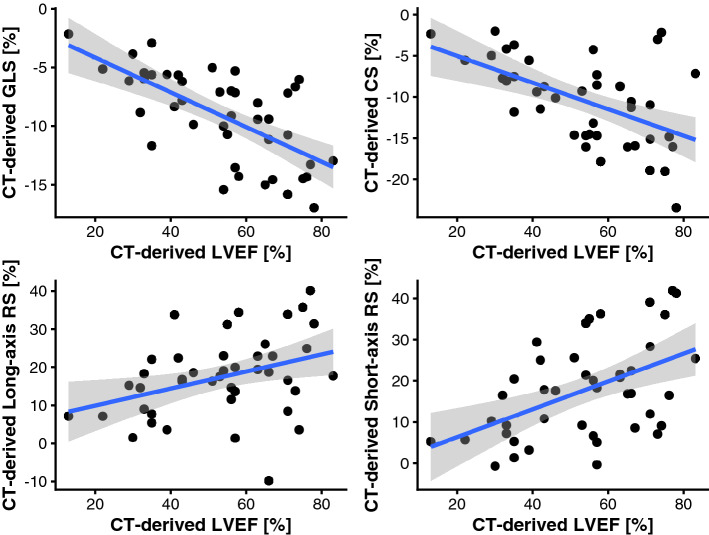
Figure 3.
Scatterplot showing the correlation of CT-derived strain in different orientations and CT-derived LVEF. Pearson’s correlation coefficients for the different orientations are as follows: GLS: r = − 0.66 (p < 0.001), CS: r = − 0.53 (p < 0.001), long-axis RS: r = 0.37 (p = 0.02), short-axis RS: r = 0.49 (p < 0.001; GLS, global longitudinal strain; CS, circumferential strain; RS, radial strain; LVEF, left ventricular ejection fraction).

