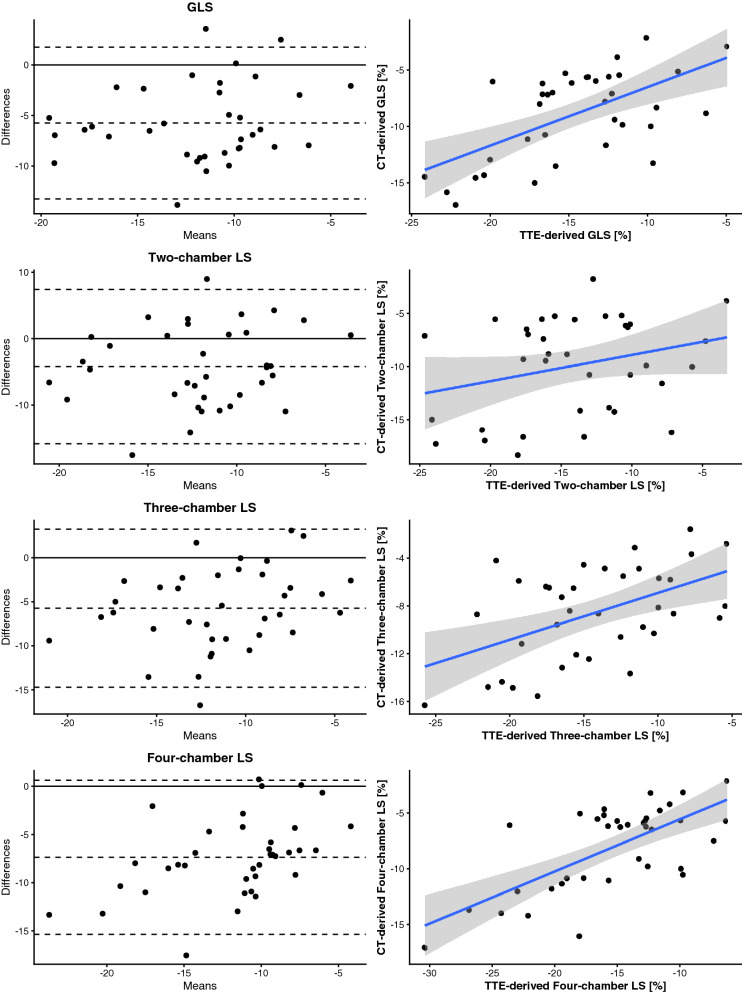
Figure 4.
Scatterplots and Bland–Altman plots of global longitudinal strain as well as longitudinal strain in the two-, three- and four-chamber view. The Pearson’s correlation coefficient was as follows: global longitudinal strain: r = 0.60, p < 0.001; two-chamber view: r = 0.28, p = 0.0929; three-chamber view: r = 0.51, p = 0.0014; four-chamber view: r = 0.69, p < 0.001. (GLS, global longitudinal strain; LS, longitudinal strain; TTE, trans-thoracic echocardiography).

