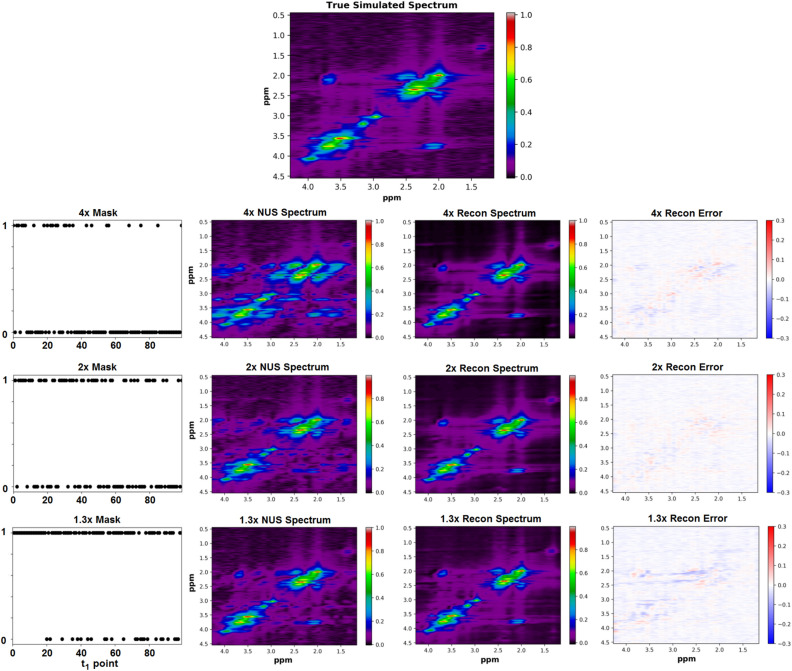
Figure 2.
A ground truth simulated L-COSY spectrum is shown (top). Sampling schemes were applied to the simulated spectrum using the sampling masks shown in the 1st column. These masks sampled 25, 50, and 75 points out of a total 100 points to yield 4x, 2x, and 1.3x acceleration factors, respectively. The 2nd column shows the under-sampled spectra in the () domain and the 3rd column shows the spectra reconstructed using a D-UNet model. Errors for each reconstruction are displayed as difference maps in the final column.

