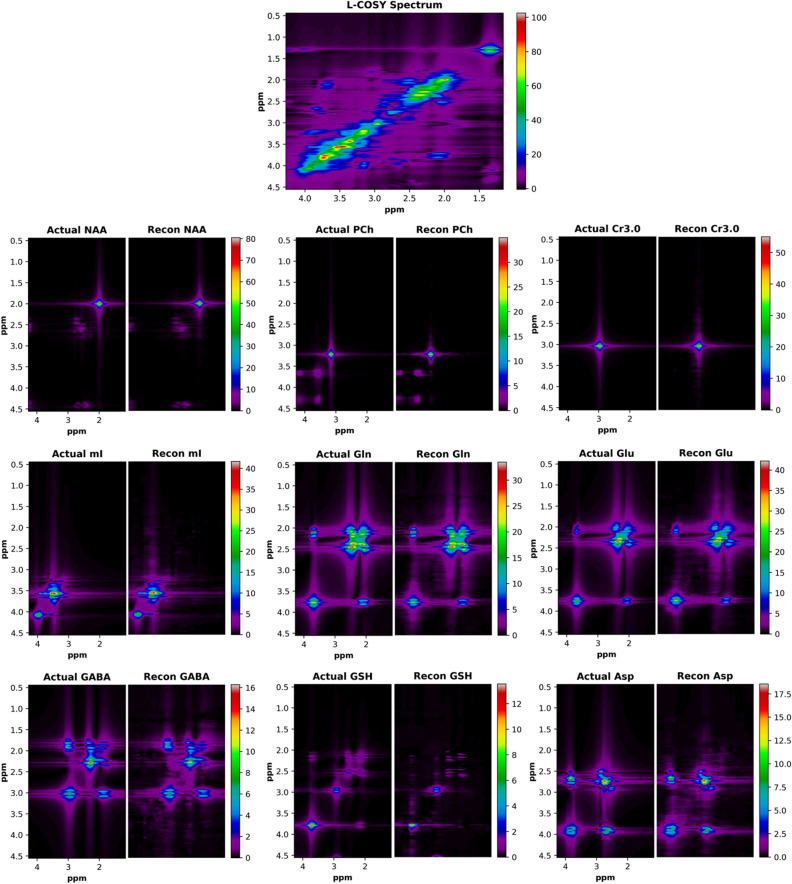
Figure 6.
The results for the quantitation D-UNet are displayed for an example fully sampled L-COSY spectrum. From the input spectrum (top), the deep learning model reconstructs each metabolite’s magnitude spectrum individually (Recon). For comparison, the actual simulated magnitude spectra (Actual) are plotted alongside the reconstructed spectra with the same intensity windows. While only 9 metabolites are displayed, the D-UNet model produces 17 metabolite spectra. The concentrations for these spectra are proportional to the signal intensities, as is standard for most fitting algorithms.

