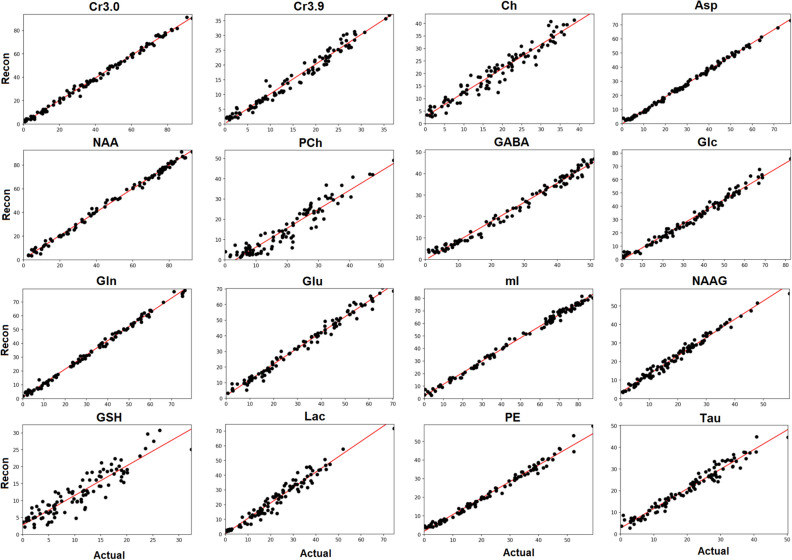
Figure 8.
The relationship between the actual metabolite concentration on the x-axis (Actual) and the reconstructed metabolite concentration on the y-axis (Recon) is shown for 16 metabolites for 100 test spectra. The spectra contained approximately 5% noise signal relative to the maximum signal intensity (noise level = 2). Overall, most metabolites displayed an expected linear relationship even at lower concentration values. Quantitative values for these results are tabulated in Table 2.

