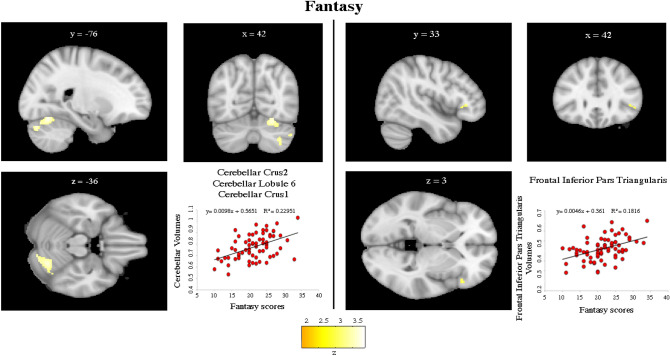
Figure 1.
Positive association between a priori Regions of Interest (ROIs) and Fantasy IRI subscale. Coordinates are in Montreal Neurological Institute (MNI) space. Z below colorbar indicates normalized t-values. In figure left is left. Areas significantly associated with Fantasy subscale in the ROI-based analyses were used as masks to extract raw data and create scatterplot. Equation, R2 and linear fit (solid black line) are reported.

