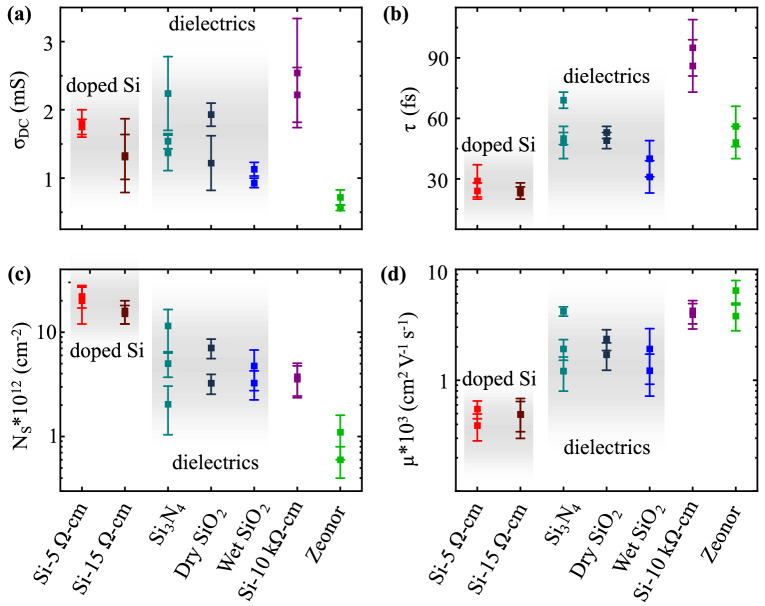
Figure 3.
Results obtained for seven distinct substrates by applying the Drude fit to our experimental conductivity spectra. The calculated transport parameters are: (a) DC conductivity σDC, (b) scattering time τ, (c) carrier density NS, and (d) mobility μ. Solid squares represent the average value measured across several spots on a sample. Error bars represent one standard deviation. Measurements are repeated at least twice for each sample on a different day under similar experimental conditions.

