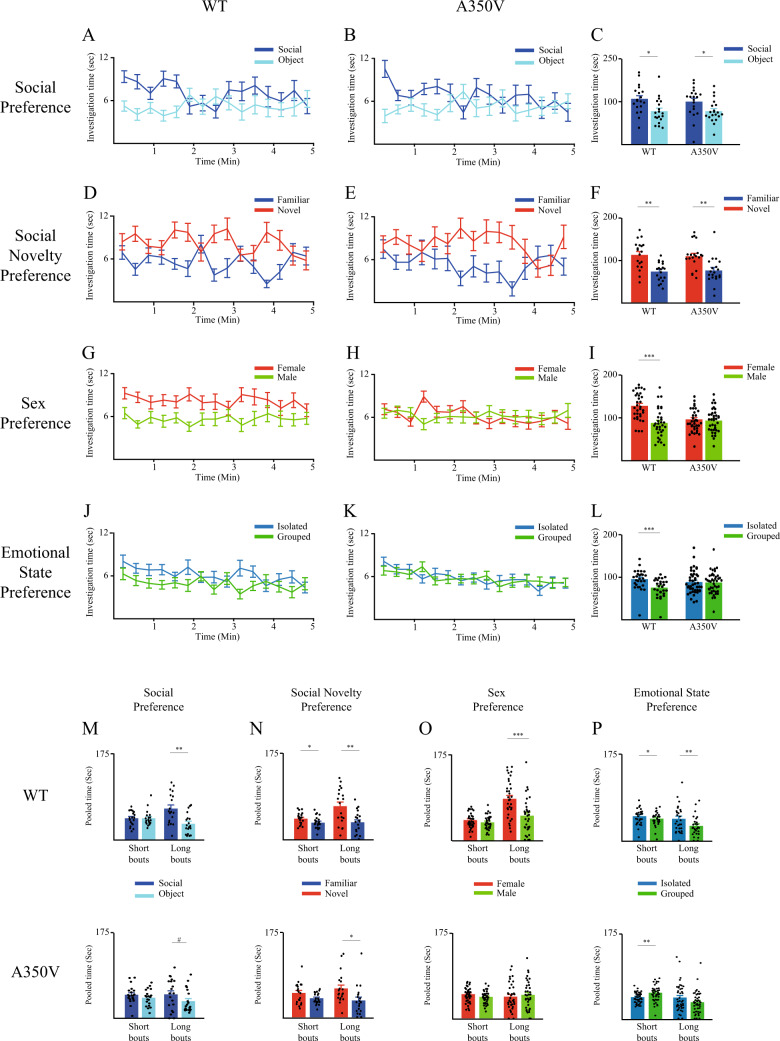
Fig. 2. Deficits in social behavior of A350V Iqsec2 mice.
A, B Mean investigation time measured separately for each stimulus (20-s bins) across the SP test for WT (A, n = 19) and A350V (B, n = 20) mice. C Mean investigation time summed separately for each stimulus throughout the SP test for WT (left) and A350V (right) subjects. D–F Same in A–C, for the SNP test (WT - n = 19, A350V – n = 20). (G–I) Same in A-C, for the SxP test (WT - n = 33, A350V – n = 36). J–L Same in A-C, for the ESP test (WT - n = 28, A350V – n = 43). (M-P) Mean investigation time of WT (above) and A350V (below) mice for each of the stimuli, pooled separately for short (<7 s) and long (≥7 s) investigation bouts, for the SP (M), SNP (N), SxP (O), and ESP (P) tests shown above (A–L). Note that A350V mice showed an atypical significant preference for the group-housed stimulus when short bouts were considered. Post hoc paired t-tests following the main effect in mixed model ANOVA test; M- WT: short bouts: t18 = −0.159, p = 0.876, long bouts: t18 = 3.109, p < 0.01; A350V: short bouts: t19 = 1.277, p = 0.217, long bouts: t19 = 6.7, p < 0.001; N- WT: short bouts: t18 = −2.286, p < 0.05, long bouts: t18 = −2.897, p < 0.01; A350V: short bouts: t19 = −1.954, p = 0.066, long bouts: t19 = −2.4, p < 0.05; O- WT: short bouts: t32 = 1.157, p = 0.256, long bouts: t32 = 3.65, p < 0.001; A350V: short bouts: t35 = −0.278, p = 0.776, long bouts: t35 = −0.243, p = 0.809; P- WT: short bouts: t27 = 2.11, p < 0.05, long bouts: t27 = 3.015, p < 0.01; A350V: short bouts: t42 = −3.23, p < 0.01, long bouts: t42 = 1.76, p = 0.086. *p < 0.05, **p < 0.01, ***p < 0.001, paired t-test following the main effect in ANOVA test. All error bars represent SEM.

