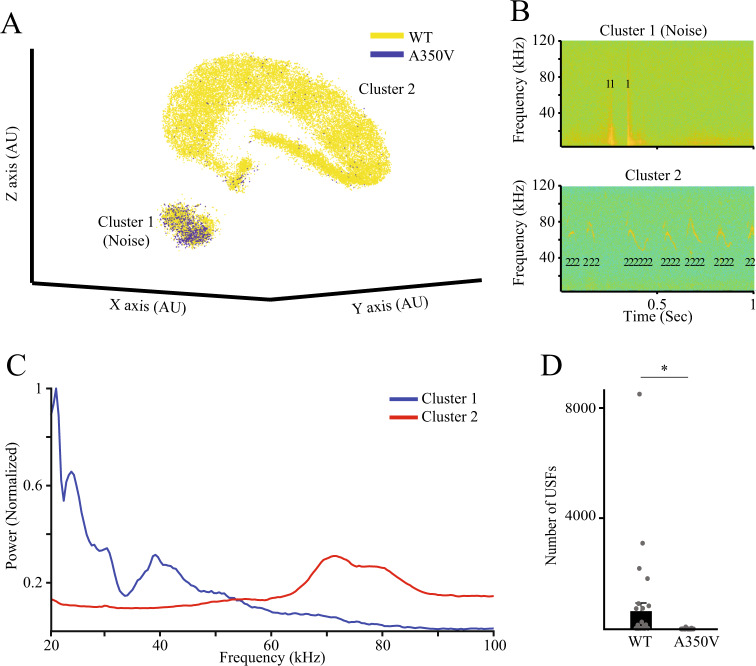
Fig. 3. A350V Iqsec2 male mice do not emit mating calls.
A 3D t-SNE analysis of all ultrasonic fragments emitted by WT (yellow; n = 31) and A350V (blue; n = 36) adult male mice during an encounter with a female C57BL/6J mouse. Note that while cluster 1 (noise) seem to contain similar number of fragments from both genotypes, cluster 2 (vocalizations) contains almost only fragments from WT mice. B Examples of USFs, denoted by their cluster numbers, superimposed on the spectrograms of their respective audio signals. Note that USFs of cluster 1 (upper example) represent non-vocal (noise) signals while USFs of cluster 2 (lower example) represent genuine vocalizations. C Power Spectral Density (PSD) analysis of all USFs recorded from all animals, calculated separately for each cluster. Note that in contrast to the PSD profile of cluster 1 which shows a wide range of frequencies, mainly at the lower range, the profile of cluster 2 shows a clear peak at the range of 60–90 kHz. D Comparison of the number of USFs from cluster 2 between the two genotypes. Note that A350V mice emitted significantly lower number of USFs as compared to WT animals (Mann–Whitney U test. U = 399.000, *p < 0.05). All error bars represent SEM.

