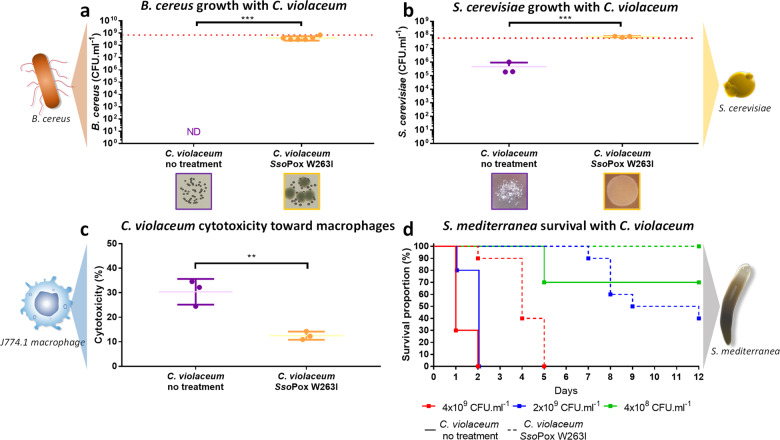
Fig. 8. SsoPox alters C. violaceum interaction with prokaryotic and eukaryotic organisms.
a Mean bacterial concentration in CFU ml−1 of B. cereus after 8 h of cocultures with C. violaceum treated with 0.5 mg ml−1 SsoPox W263I (yellow) and untreated cultures as negative controls (purple). Error bars represent the standard deviations of n = 6 experiments (three biological replicates × two technical replicates). The dotted red line represents the mean bacterial concentration of B. cereus monoculture. Representative pictures of dilution on LB-Agar plate (dilution factor at 10−6) of B. cereus cultures with treated cultures of C. violaceum with 0.5 mg ml−1 SsoPox W263I (yellow square) and untreated cultures as negative controls (purple square) are given. ***P values <0.001 according to the Student’s t test. ND not detected. b Mean yeast concentration in CFU ml−1 of S. cerevisiae after 24 h growth on YPD-Agar infected by C. violaceum treated with 0.5 mg ml−1 SsoPox W263I (yellow) and untreated as negative controls (purple). Error bars represent the standard deviations of n = 3 biological replicates. The dotted red line represents the mean yeast concentration of S. cerevisiae on non-infected YPD-Agar. Representative pictures of dilution on YPD-Agar plate (dilution factor at 10−2) of S. cerevisiae growth on the plate infected by treated cultures of C. violaceum with 0.5 mg ml−1 SsoPox W263I (yellow square) and untreated cultures as negative controls (purple square) are given. ***P values <0.001 according to Student’s t test. ND not detected. c Cytotoxicity of C. violaceum toward J774.1 macrophages with 0.5 mg ml−1 SsoPox W263I (yellow) or untreated as negative controls (purple) during a 1.5 h infection at a MOI of 1. Error bars represent the standard deviations of n = 3 replicated experiments. **P values <0.01 according to Student’s t test. d Planarian survival in the presence of C. violaceum treated with 0.5 mg ml−1 SsoPox W263I (dotted line) and untreated cultures as negative controls (full line) at 4 × 10⁹ CFU ml−1 (red), 2 × 10⁹ CFU ml−1 (blue), 4 × 10⁸ CFU ml−1 (green). Curves represent survival proportions of ten planarians. According to log-rank (Mantel–Cox) test comparing survival curves in treated and untreated conditions P values <0.0001 for 4 × 10⁹ CFU ml−1 and 2 × 10⁹ CFU ml−1 conditions and P value = 0.0671 for 4 × 10⁸ CFU ml−1 concentration.

