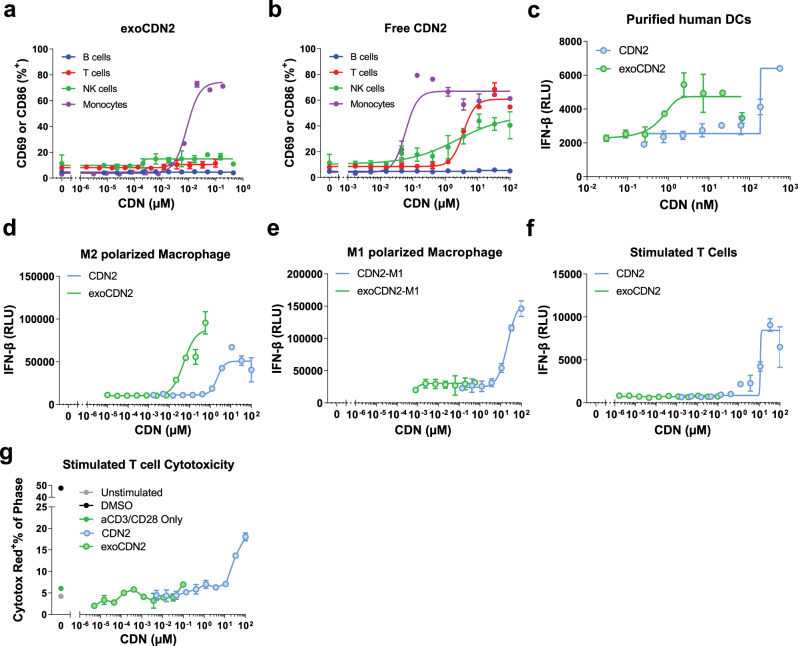
Fig. 6. Preferentially uptake and activation of STING pathway in APCs by exoSTING.
a, b Representative dose-response curves (n = 3 healthy donors) of activation of purified B cells, T cells, NK cells, and Monocytes from PBMCs after treatment of exoCDN2 (a) or free CDN2 (b) (n = 2 biological replicates per donor). CD86 expression was assessed as a cell activation marker for monocytes, whereas CD69 was used as an activation marker for T cells, NK cells, and B cells. c Representative dose-response curves (n = 4 healthy donors) of IFN-β production in purified human DCs after treating with exoCDN2 and free CDN2 (n = 2 biological replicates per donor). d, e Representative dose-response curves (n = 3 healthy donors) of IFN-β production in M2 polarized human macrophages (d) and M1 polarized human macrophages (e) after treating with exoCDN2 and free CDN2 (n = 2 biological replicates per donor). f, g Representative dose-response curves (n = 3 healthy donors) of IFN-β production (f) and cytotoxicity (g) in stimulated T cells after treating with free CDN2 and exoCDN2 (n = 2 biological replicates per donor). T cells were purified from human PBMCs and stimulated with anti-CD3/anti-CD28. Data are presented as means ± s.e.m from replicate samples as indicated. RLU relative luminescent unit.

