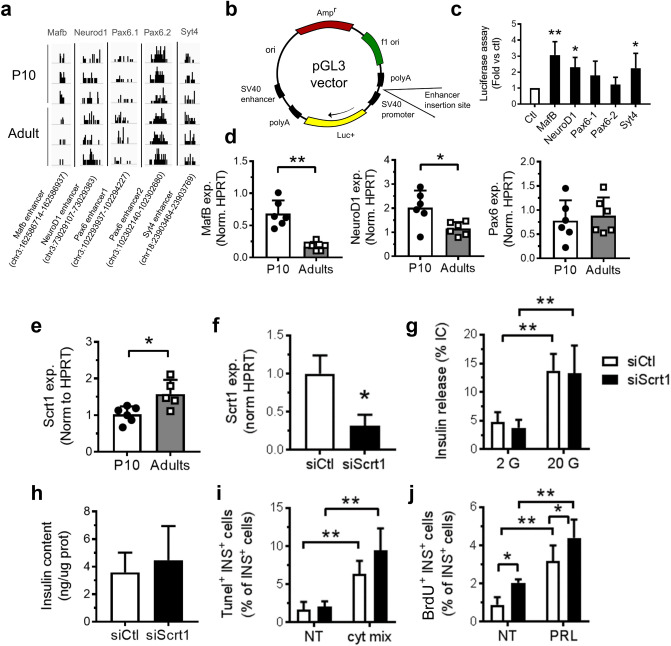
Figure 2.
Enhancer activity assessment and Scrt1 function. (a) Trn5 integrations on Mafb, Syt4, Neurod1 and two Pax6 accessible sites. (b) Scheme of pGL3 vector used for the luciferase assay. (c) Luciferase activity was measured in INS 832/13 cells transfected with an empty pGL3 vector (Ctrl) or a pGL3 vector containing an enhancer region for the indicated gene (Mafb, NeuroD1, Pax6 and Syt4). Results are expressed as fold change versus control. (d) Gene expression in P10 and adult rat islets were measured by qPCR and normalized to the housekeeping gene Hprt1. Syt4 gene expression is available in Fig. 3. * p < 0.05, ** p < 0.01 by Student’s t-test or by one-way Anova, Dunnett’s post-hoc test. (e–f) Scrt1 expression was measured by qPCR and normalized to Hprt1 housekeeping gene levels. (f–j) Dispersed adult rat islet cells were transfected with a control siRNA (siCtl) or siRNAs directed against Scrt1 (siScrt1). Experiments were performed 48 h post-transfection. Insulin release in response to 2 or 20 mM glucose (g,h) insulin content were determined by ELISA n = 3. (i) Apoptosis of insulin-positive cells was assessed using Tunel assay in basal (NT) condition or in response to a mix (cyt mix) of pro-inflammatory cytokines (IL-1β, TNF-α and IFN-γ) n = 5. (j) The fraction of proliferative insulin-positive cells was determined by BrdU incorporation in basal (NT) or stimulated (prolactin, PRL) conditions, n = 6. * p < 0.05, ** p < 0.01 by Student’s t-test or by one-way Anova, Tukey’s post-hoc test. See also
Source data (4) and supplementary Fig. S3.

