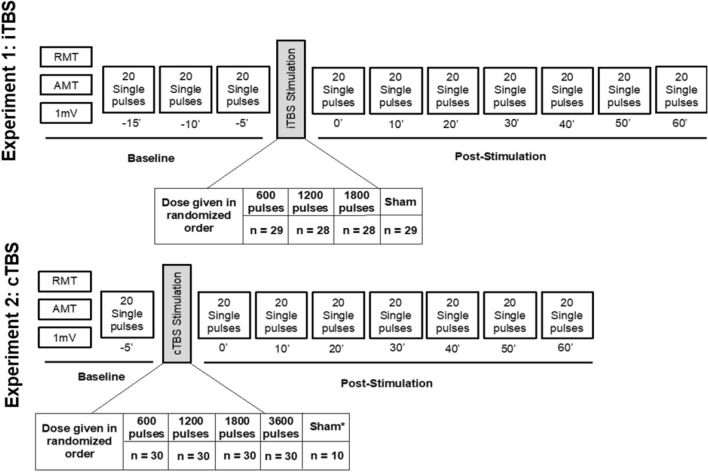
Figure 1.
Diagram of experimental design for iTBS and cTBS experiments. This diagram represents the flow of assessments performed on a given visit. Each visit began with resting, active and 1 mV thresholds. Next, 20 baseline MEPs were collected prior to TBS administration (for participants in the iTBS experiment this was performed 3 times). A dose of iTBS or cTBS was administered at 80% aMT. Directly following stimulation 20 MEPs were collected and repeated at 10-min intervals thereafter. Only a subset of participants during Experiment 2 received sham stimulation.

