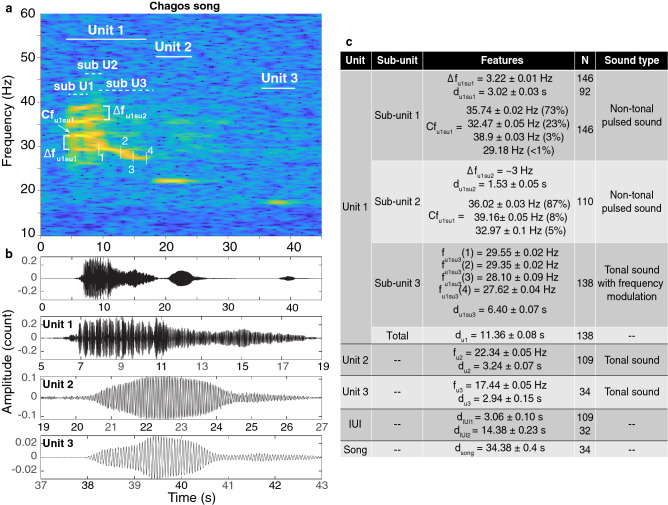
Figure 3.
Spectrogram (a) and waveforms (b) of a Chagos song recorded on the eastern side of the Chagos Archipelago (DGS) in August 2017. Detailed waveforms show the signal structure of the units within the song. Spectrogram parameters: Hamming window, 1024-point FFT length, 90% overlap. Note that the axes differ among plots. (c) Measurements (mean ± standard error (s.e.)) of the acoustic features. N is the number of measurements, stands for where i and j are the unit and subunit numbers, designates the frequency difference between the sidebands, f and d are the frequency and duration of the feature indicated in subscript, and when present, the number in brackets refers to the point measured as indicated on the spectrogram. or designate the xth harmonic of a sound, and Cf designates the carrier frequency of a sound.

