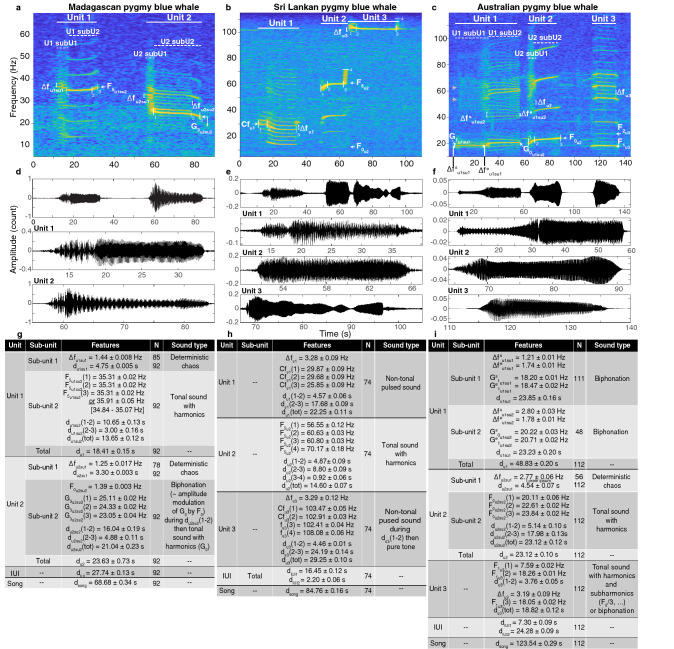
Figure 5.
Spectrograms (upper panels) and waveforms (middle panels) of the song of the Madagascan, Sri Lankan and Australian pygmy blue whales, including detailed waveforms to show the internal signal structure. The Madagascan song was recorded off Crozet Island (CTBTO records, site H04S1) in April 2004, the Sri Lankan song was recorded at DGN (CTBTO records, site H08N1) in April 2009 and the Australian song was recorded at Perth Canyon in March 2008 (IMOS records). (Spectrogram parameters: Hamming window, 1024-point FFT length, 90% overlap. Note that the axes differ among plots.) And measurements (mean ± s.e., lower panels) of the acoustic features of the different song types. N is the number of measurements, stands for where i and j are the unit and subunit numbers, designates the frequency difference between the sidebands, f and d are the frequency and duration of the feature indicated in subscript, and when present, the number in brackets refers to the point measured as indicated on the corresponding spectrogram. or designate the xth harmonic of a sound, and Cf designates the carrier frequency of a sound.

