Figure 9.
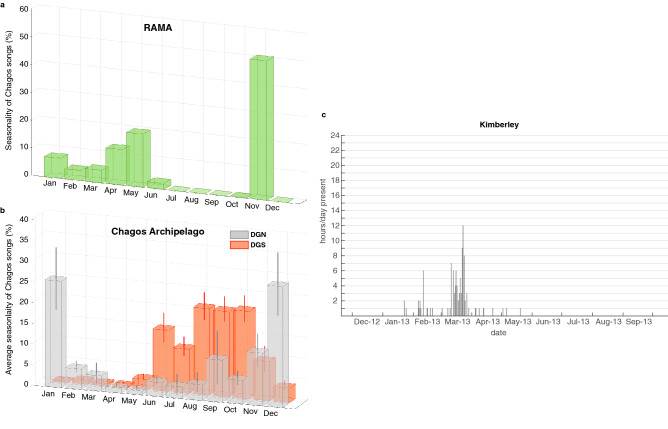
(a) Seasonality of Chagos songs at RAMA in 2013, presented as a percentage of songs per month (i.e. monthly number of songs divided by total number of songs detected in the year); (b) Seasonality of Chagos song averaged over the years (±SE) on the western (DGN—gray) and eastern (DGS—orange) sides of the Chagos Archipelago. This average seasonality is calculated as such: the monthly number of songs is divided by the total number of songs detected in the corresponding year, and averaged over the years. Note that due to the low number of recording days at DGN in 2007 and 2014, and in 2007 at DGS, these years were removed from the averaging (DGN: 11 years and DGS: 15.5 years); (c) Hourly presence of Chagos songs in Kimberley (Western Australia) in 2012–2013. Note that the metric and thus the graphic representation used for this site is different from that for RAMA and DGN/DGS: in the Kimberley data set, Chagos songs were logged upon visual inspection of the spectrograms, and a metric of hourly presence/absence of the song per day was used (see the Methods section for details).

