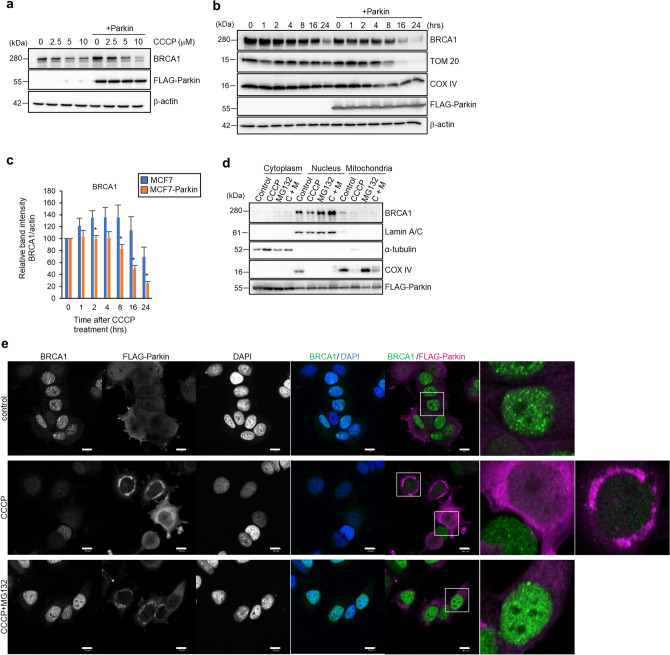
Figure 2.
Parkin promotes BRCA1 degradation after mitochondrial damage via the ubiquitin–proteasome pathway and is co-localized in nucleus. (a) MCF7 and MCF7-Parkin cells were treated with CCCP at the indicated concentrations for 24 h, and then BRCA1 protein level was assessed by Western blotting. (b) Protein levels of BRCA1 as assessed by Western blotting. MCF7 and MCF7-Parkin cells were treated with 10 μM CCCP for the indicated times. Representative images from seven independent experiments are shown. TOM20 and COX IV were assessed to verify the occurrence of mitophagy. Because the overexpression of Parkin accelerates mitophagy, the degradation of TOM20 and COX IV in MCF7-Parkin cells after CCCP treatment was faster than that in MCF7 cells. (c) Densitometry analysis of BRCA1 in (b). Each band intensity was standardized against β-actin, and relative band intensities were calculated. n = 7, bar = means ± S.E., *p < 0.05 versus MCF7 at the same time point. (d) MCF7-Parkin cells were separated into the cytoplasmic, nuclear, and mitochondrial fractions after treatment with 0 or 10 µM CCCP and 0 or 10 µM MG132 for 24 h. Each fraction was subjected to Western blotting. Lamin A/C, α-tubulin, and COX IV were used as markers of the nuclear, cytoplasmic, and mitochondrial fractions, respectively. (e) Subcellular localizations of BRCA1 and FLAG-Parkin in MCF7-Parkin cells were assessed by immunofluorescence. Cells were treated with a vehicle, 10 μM CCCP, or 10 µM CCCP + 10 μM MG132 for 5 h. The treatments are indicated on the left side, and the detected proteins are indicated at the top. In the merged panels, BRCA1, FLAG-Parkin, and the nuclei are shown in green, magenta, and blue, respectively. The small boxed images are enlarged in the right panels. Scale bar = 10 μm.

