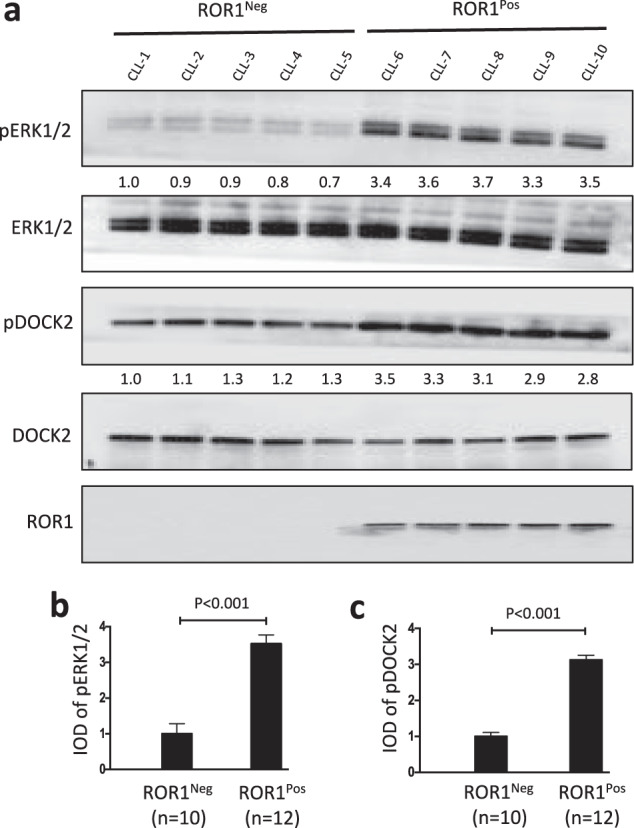
Fig. 5. Phosphorylation of ERK1/2 or DOCK2 is high in ROR1Pos CLL.

a Immunoblot analysis of lysates prepared from primary CLL cells of different ROR1Pos or ROR1Neg patients; membranes were probed with anti-ERK1/2, anti-phospho pERK1/2, as indicated on the left (upper panels). The numbers between two lanes are ratios of band IOD of phosphorylated ERK1/2 relative to total ERK1/2, and normalized with respect to that of CLL-1. Middle panels provide immunoblot analyses of anti-DOCK2 ip, using lysates prepared from ROR1Pos or ROR1Neg CLL cells; membranes were probed with anti-DOCK2, anti-phospho tyrosine (pDOCK2), as indicated on the left (middle panels). The numbers between two lanes are ratios of band IOD of phosphorylated versus total DOCK2, and normalized with respect to that of CLL-1. An immunoblot of the whole-cell lysates probed with anti-ROR1 mAb is provided in the bottom panel. b Phosphorylation of ERK1/2 was measured by immunoblot analysis, using lysates prepared from ROR1Pos CLL cells (N = 12 patient samples, (8 U-CLL and 4 M-CLL)) or ROR1Neg CLL cells (n = 10 patient samples, (3 U-CLL and 7 M-CLL)). The ratios of band IOD of phosphorylated versus total ERK1/2 was determined, normalized to that of CLL-1, and depicted in the graph. Data are shown as mean ± SD. P < 0.001, as assessed by 2-tailed Student’s t test. c Phosphorylation of DOCK2 was measured by immunoblot analysis of anti-DOCK2 ip, using lysates prepared from primary CLL cells of different ROR1Pos (n = 12, (8 U-CLL and 4 M-CLL)) or ROR1Neg (n = 10, (3 U-CLL and 7 M-CLL)) patients. The ratios of band IOD (integrated optical density) of phosphorylated versus total DOCK2 was determined, normalized to that of CLL-1, and plotted in the graph. Data are shown as mean ± SD. P < 0.001, as assessed by 2-tailed Student’s t test.
