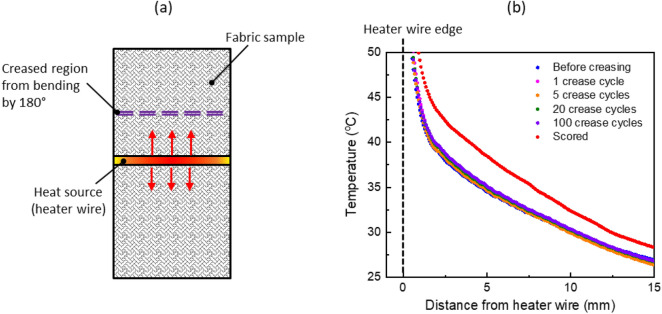
Figure 6.
(a) Schematic diagram showing the top-view of the testing configuration to assess impact of creasing on thermal performance. The fabric sample is creased by bending by 180° at a specific location as indicated, and infrared temperature maps are captured before and after creasing. (b) Steady state temperature profile as a function of distance from the heater wire on the creased side of the fabric swatch, shown for increasing number of crease cycles and after scoring. The temperature profiles indicate no significant change in heat spreading properties except for the extreme scenario of scoring to purposely damage the individual yarns.

