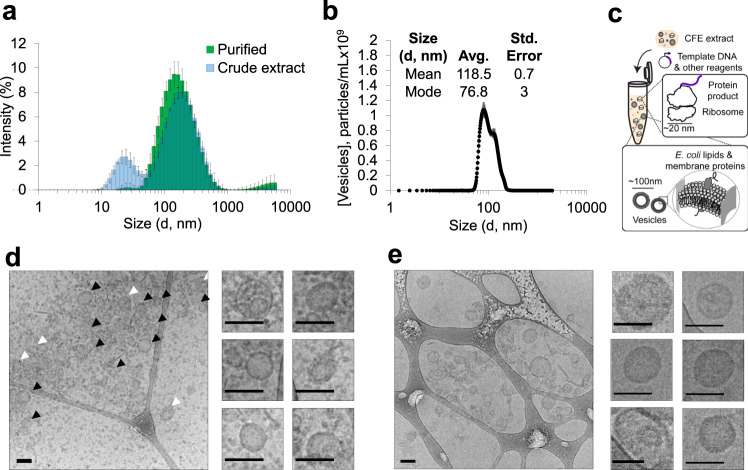
Fig. 2. Characterization of membrane vesicles in crude CFE extracts.
a DLS analysis of crude extracts (blue) and SEC purified vesicles (green). Crude extract data are presented as mean intensity values for a given size ± standard deviation (SD) of n = 9 measurements (3 biologically independent extracts, each measured 3 times). Purified vesicle data are presented as mean intensity values for a given size ± SD of n = 3 measurements (one purified fraction measured 3 times). b NTA of purified vesicles collected from SEC. Mean and mode diameters observed in the particle size distribution are listed in the inset. Data are presented as mean ± standard error of the mean (SEM) of n = 5, 1 min NTA measurements of purified vesicles. c Illustration of particles detected in crude CFE extracts. d Cryo-EM micrographs of crude extracts. Black arrows indicate vesicles with apparent unilamellar morphology. White arrows indicate nested or multilamellar morphologies. Cropped images indicate representative vesicles. Scale bars are 100 nm. Uncropped images are available in Supplementary Fig. 3 and numbered with the corresponding cropped vesicles. e Cryo-EM micrographs of SEC purified vesicles. Cropped images indicate representative purified vesicle particles. Scale bars are 100 nm. Uncropped images are available in Supplementary Fig. 3 and numbered with the corresponding cropped vesicles. Micrographs are representative of three independent experiments. Source data for all panels are provided as a Source Data file.

