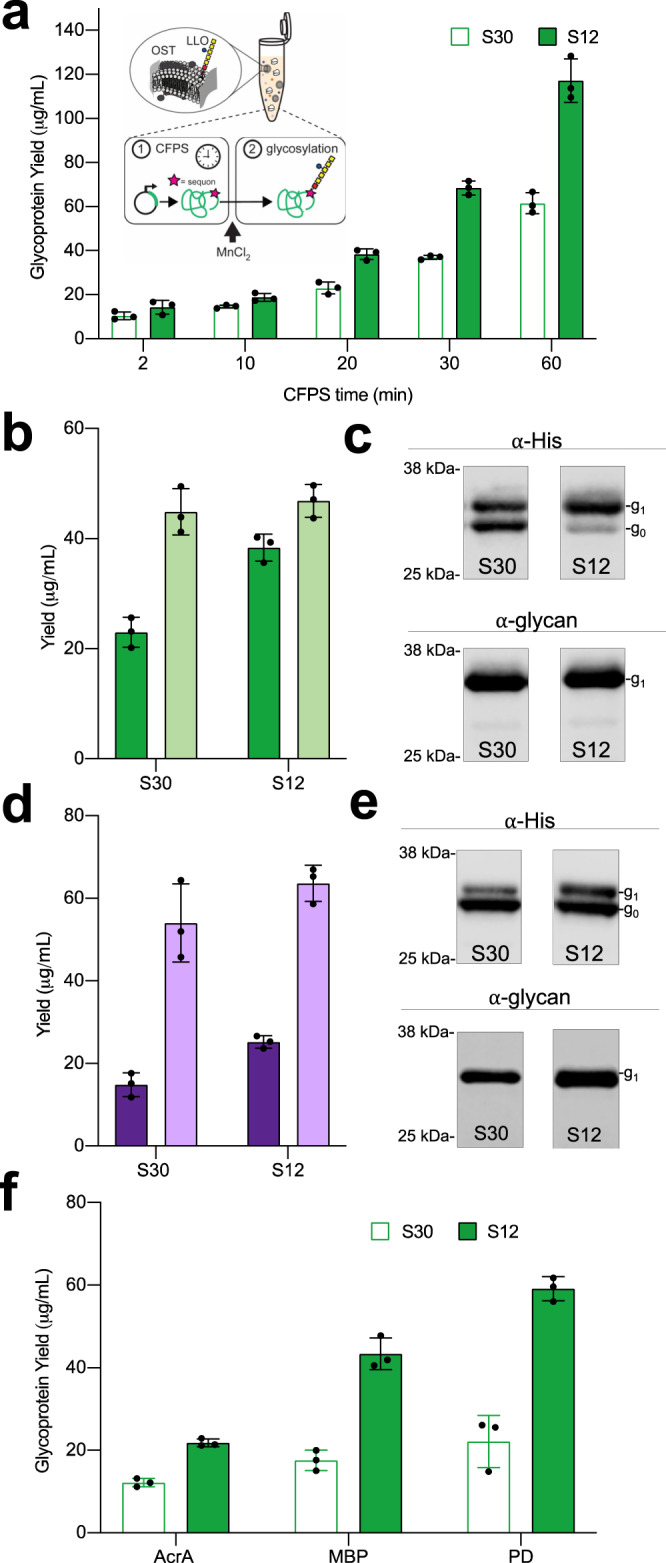
Fig. 5. Increasing vesicle concentrations improves cell-free glycoprotein synthesis (CFGpS) for N- and O-linked glycosylation systems.

For panels (a–e), a standard curve correlating protein yields derived from 14C-leucine counting and sfGFP fluorescence was used to measure total protein concentrations. Quantitative western blotting was used to measure fraction of glycosylated protein. For panel (f), protein concentrations were measured using 14C-leucine incorporation. Fraction of glycosylated protein was measured using autoradiography. a sfGFP glycoprotein yields of CFGpS reactions charged with S12 (green) or S30 (white) extracts enriched with PglB and C. jejuni LLO. Data are presented as mean ± SD of n = 3 biologically independent CFGpS reactions. (Inset) Schematic of two-phase CFGpS reactions. b Glycosylated (dark green) and total (light green) sfGFP yields of N-linked CFGpS reactions with 20 min CFPS times. Data are presented as mean ± SD of n = 3 biologically independent CFGpS reactions. c Anti-His and anti-glycan western blots of acceptor proteins from representative reactions in (b) show glycosylated (g1) and aglycosylated (g0) protein. Full western blot images are available in Supplementary Fig. 9A–D and Source Data file. d Glycosylated (dark purple) and total (light purple) sfGFP yields from O-linked CFGpS reactions with 20 min CFPS times. Data are presented as mean ± SD of n = 3 biologically independent CFGpS reactions. e Anti-His and anti-glycan western blots of acceptor proteins from representative reactions in (d) show glycosylated (g1) and aglycosylated (g0) protein. Full western blot images are available in Supplementary Fig. 12A, B and Source Data file. f Glycoprotein yields of AcrA, MBP, and PD produced in CFGpS reactions charged with S12 (green) or S30 (white) extracts enriched with PglB and C. jejuni LLO. Glycoprotein yields of AcrA, which contains 2 internal glycosylation sites, include singly and doubly glycosylated protein. Data are presented as mean ± SD of n = 3 biologically independent CFGpS reactions. Source data for all panels are provided as a Source Data file.
