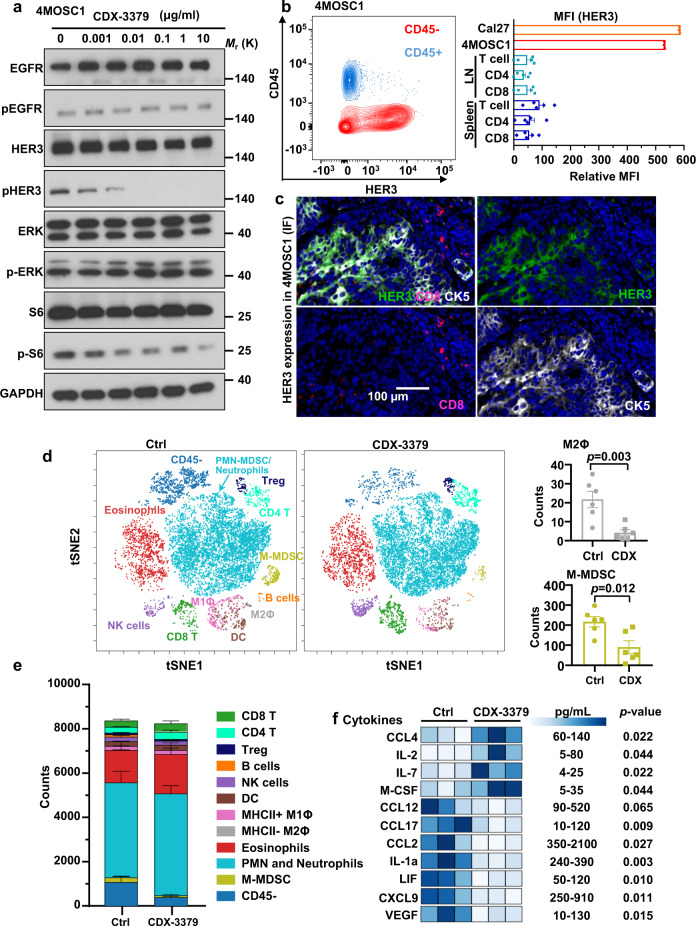
Fig. 5. HER3 inhibition with CDX-3379 in syngeneic HNSCC model remodels the tumor immune microenvironment.
a 4MOSC1 cells were treated with different concentrations of CDX-3379 for 1 h and cell lysates were analyzed by western blot analysis as indicated. Data shown are representative blots of results from three independent experiments with similar results. b Left, single cell suspension of 4MOSC1 tumors was stained with CD45 and HER3 antibodies and analyzed by flow cytometry. Shown is a representative flow cytometry plot of the frequency of tumor cells (CD45−) and immune cells (CD45+) expressing HER3 (n = 4). Right, in mice with 4MOSC1 tumors, HER3 expression was measured in CD90.2+ T cells, CD90.2+ CD4+ T, and CD90.2+ CD8+ T cells in both the cervical lymph node (LN) and splenic compartment (the relative HER3 MFI of Cal27 and 4MOSC1 cells from culture serve as a positive control). Data were reported as relative mean fluorescence intensity (MFI) as compared to FMO (n = 3 for Cal27 and 4MOSC1; n = 5 for lymph nodes and spleen); Relative MFI was calculated by subtracting MFI-HER3 from MFI-FMO. c Immunofluorescent staining of CD8, HER3, and CK5 in slides of 4MOSC1 tumors to show HER3 co-expressed with cancer cells (CK5 positive), but not with CD8+ T cells. d Left, C57Bl/6 mice with 4MOSC1 tumors were treated IP with isotype control antibody and CDX-3379 (20 mg/kg) (n = 6). Biological populations identified via CyTOF were categorized in tSNE map. FlowSom depiction of different cell lineages within in the tumor micronvironment (colored) were identified by lineage-specific markers. Right, count of M2 macrophages (M2Φ) and M-MDSC cells. Data were reported as mean ± SEM; two-sided Student’s t-test. e Total count of major immune cell population within live cells from panel (d). f Chemokine and cytokine protein expression profile in 4MOSC1 tumors. Tongue tumors were established and treated as in panel d. Tumor lysates (total protein concentration 2 mg/ml) were used for mouse cytokine array/chemokine array analysis. Significantly altered molecules and the pg/mL range with HER3i are shown (n = 3). Data were reported as mean ± SEM; two-sided Student’s t-test. Source data are provided as a Source Data file.

